

Higher ed social pros, the wait is over! The annual Higher Education Social Media Engagement report is here, with the climbers, the close calls, and the social media teams that crushed it in 2024-25.
This year, the Higher Education Social Media Engagement Report is hosted here on Quid.com. It’s the same trusted Rival IQ report, now part of the Quid family, bringing Rival IQ’s benchmarks together with Quid’s broader intelligence platform.
We analyzed every Division I and II school across Instagram, Facebook, X (Twitter), and TikTok to deliver engagement benchmarks and standout trends. A few clear themes rose to the top, cutting across regions and channels, powering many of the highest-engaged posts in higher ed over the past year.
Three clear themes bubbled up across channels and formats. Together they account for a big chunk of total engagement, and they’re shaped by where you publish: Instagram supplies the most volume, TikTok supercharges rates and spikes on video, and Facebook adds steady, nostalgia-fueled reach.
Every spring, commencement turns into a momentum machine. Caps and gowns, walk-the-stage clips, and ceremony highlights pull the whole community into one shared celebration. Posts that zoom in on individual grads or goosebump surprises, such as first-generation graduate spotlights, and unexpected reunions blend pride, belonging, and closure, and the comments fill with tags and congratulations.

Video leads the way, driving the highest total engagement with a median engagement rate of 9.88%, while carousels/Reels neatly recap the day and rack up saves. Simple photo announcements still remain strong for pride-forward hits. Platform-wise, Instagram is the main stage, comprising 49.9% of this theme’s engagement with a 5.84% median engagement rate. TikTok acts as the accelerant, contributing roughly 38.5% of the theme with a whopping 11.30% median engagement rate with short, emotional clips (cap tosses, hugs, surprises).

Between tentpole moments, campus beauty shots keep the engagement rolling in. Seasonal color, sunset skies, snow days, and those “just walking to class” glimpses package campuses as catnip for prospective students and a nostalgia trigger for alumni.

Carousels quietly do the heavy lifting, stacking total engagement via swipes and saves, while short video drives higher engagement rates (12.57%) with timelapses, quick pans, and passing-weather reels. Photos tie the weeks together as dependable fillers, and Instagram dominates this lane, comprising roughly 70.2% of the theme’s engagement with a 5.85% median reengagement rate. TikTok’s scenic clips pop with a 13.40% median engagement rate, typically outperforming static shots.

Athletics content is a tried-and-true driver of engagement. Gameday posts, game results, rivalry wins, trophies, and tournament runs ignite some of the highest engagement volumes, firing up students, alumni, and local fans at scale.

Short video again wears the crown, generating the most total engagement with a median engagement rate of 11.80%. The recipe is simple: big plays, bigger reactions, and locker-room euphoria. Carousels make excellent gameday galleries, and photos keep team spirit visible between contests. TikTok leads share for this theme at about 47.5% with a 13.59% median engagement rate, while Instagram follows with roughly 42.0% and a 5.89% median engagement rate. Twitter/X can deliver solid engagement from athletics-specific handles, though flagship institutional accounts usually see lower overall impact.

Gamecocks Repeat! Hats off to the University of South Carolina, Columbia, which has earned the No. 1 ranking in Division 1 for the second straight year! While already known as a top-tier public research institution with amazing school spirit and vibrant campus life, the Gamecocks also have an elite social media presence, joining our Top 10 list for the fourth consecutive year, and ranking among the top in all four of the social media channels measured in our 2025 report.

Yellowjackets Rejoice! Congratulations to Cedarville University for snagging Gold in our Division 2 rankings, skyrocketing from No. 18 in 2024 to No. 1 in 2025. The private religious institution is renowned for its strong commitment to biblical integration in academics and campus life, but now it also has bragging rights with a top-shelf social media presence, where the Yellowjackets are extra proficient on Instagram and TikTok, the two favorite social channels of college students everywhere.

While it’s no secret to higher-ed social media professionals, Instagram and TikTok once again reign supreme as the preferred social channels. Instagram continues to pile up the most total engagements, while TikTok earns the highest engagement rates.
While we already know higher education’s primary audience — Gen Z — prefers TikTok and Instagram, most social media professionals still have content strategies for Facebook (alumni, local campus communities) and X (news, athletics). That being said, daily use and total engagement continues to trend downward on both platforms.
On X, total posts plummeted by 27% on average in 2024-25, while total engagements fell 4%, despite a slight uptick in X engagement rate by follower, which rose from 0.09% in 2023-24 to 0.12% this year among the 667 institutions we studied.
On Facebook, the numbers fell across all data points, with total posts dropping 8%, total engagements dipping almost 4%, and engagement rate falling to an all-time low of 0.29% in 2024-25.
Regardless of averages, many schools still rose to the occasion and found value on both platforms with highly engaged posts that resonated with their target audiences. Here’s a look at the Top ten colleges and universities for Divisions 1 and 2 on Facebook and X this year:
Aligned with the overall decline in social media use over the past year, the numbers in higher-ed are also trending downward, with the average institution publishing 15% fewer posts in 2024-25. This shows schools are taking a more measured and approach to content creation, and it’s a tactic that is proving efficient, as schools generated only 0.5% fewer total engagements this year, despite publishing 15% few posts.
However, colleges and universities are also experiencing slowed follower growth, added an average of 17.9k net followers across all four social channels measured in 2024-25, a decline of 9% from the previous year.
One of the most exciting additions to this year’s report is a look at how rankings changed compared to 2024. The results show just how quickly schools can rise when they lean into the right mix of creativity, consistency, and connection with their audiences.
Several Division I schools saw huge jumps this year. Vanderbilt University climbed an impressive 160 spots to land at #15 overall, powered by high-energy athletics content and student-driven TikToks. Mississippi State University also surged, moving up 154 places into the Top 20 thanks to a steady stream of fan-focused, trend-savvy posts.
Division II schools made some of the most remarkable leaps in the entire report. Saint Martin’s University rocketed up 232 places to break into the Top 30, while both Vanguard University and Augusta University jumped more than 150 spots each. These schools show how leaning into video-first storytelling and community-centered content can deliver major engagement gains in just one year.
These dramatic moves underscore the power of video-led, student-authored content on TikTok and Instagram, where authentic storytelling can rapidly reshape a school’s social standing. At the same time, schools that posted less frequently or leaned too heavily on Facebook and X struggled to hold ground, reflecting shifting student preferences.
Comparing your school’s social performance has never been easier. Browse our D1 and D2 live benchmarks for a real-time look at top Higher Education posts, engagement rates, high-performing hashtags, and tons more. You can even add these benchmarks directly into your Rival IQ account for always-on monitoring of these top schools.
Need even more competitive analytics? Go head-to-head with a free report on TikTok, Facebook, Instagram, or Twitter to see how you stack up against your top competition. See what makes your competitors tick with key insights and actionable advice you can start using now to come out on top.
If you’re hungry for even more stats, start a free 14-day trial with Rival IQ.
We surveyed all D1 and D2 colleges and universities on social media between June 1, 2024, and May 31, 2025, on Facebook, Instagram, TikTok, and Twitter. Using this data and a weighted formula, we generated an overall engagement ranking for each school. The top-ranked colleges and universities on social media have high engagement rates with average or better audience size and posting volumes.
We define engagement as measurable interaction on social media posts, including likes, comments, favorites, retweets, shares, and reactions. We used engagement rate by follower to measure engagement on Facebook, Instagram, and Twitter, which is defined as the total engagement divided by the number of followers. We used engagement rate by view to measure engagement on TikTok, which is defined as the total engagement divided by the number of views.
Please note: If you haven’t grabbed your school’s TikTok handle yet, consider doing so now even if you’re not ready to post there yet. There are a ton of imposters on TikTok snapping up handles, and we’d hate to see you struggle for a handle that matches your university’s brand by waiting too long.
Why benchmark instead of just measuring how your school’s individual performance changes over time? Because social success is relative. Benchmarking means figuring out what’s working (and what isn’t) in your industry and measuring your success against that.
It’s crucial to go beyond likes and favorites because audience size is hugely important: 100 likes is great engagement for a college or university with 1,000 followers but is a drop in the bucket to a school with 100,000 followers. Engagement rate helps us take audience size into account to see who’s really reaching the highest percentage of their fans and followers with their social posts, which are the schools you need to beat.
The rankings tell us who’s winning on social media, but they’re only part of the story. With Quid, we can see the broader conversations shaping higher education across both social and traditional media.

In the news and blog landscape, faculty and staff are at the center of attention. Evolving faculty development accounts for 11% of coverage, highlighting the pressure on universities to adapt teaching and research roles for a changing academic environment. Alongside this, innovative campus and urban development (8.4%) and enrollment trends and challenges (6%) reveal how institutions are positioning themselves for growth while navigating shifting demographics.
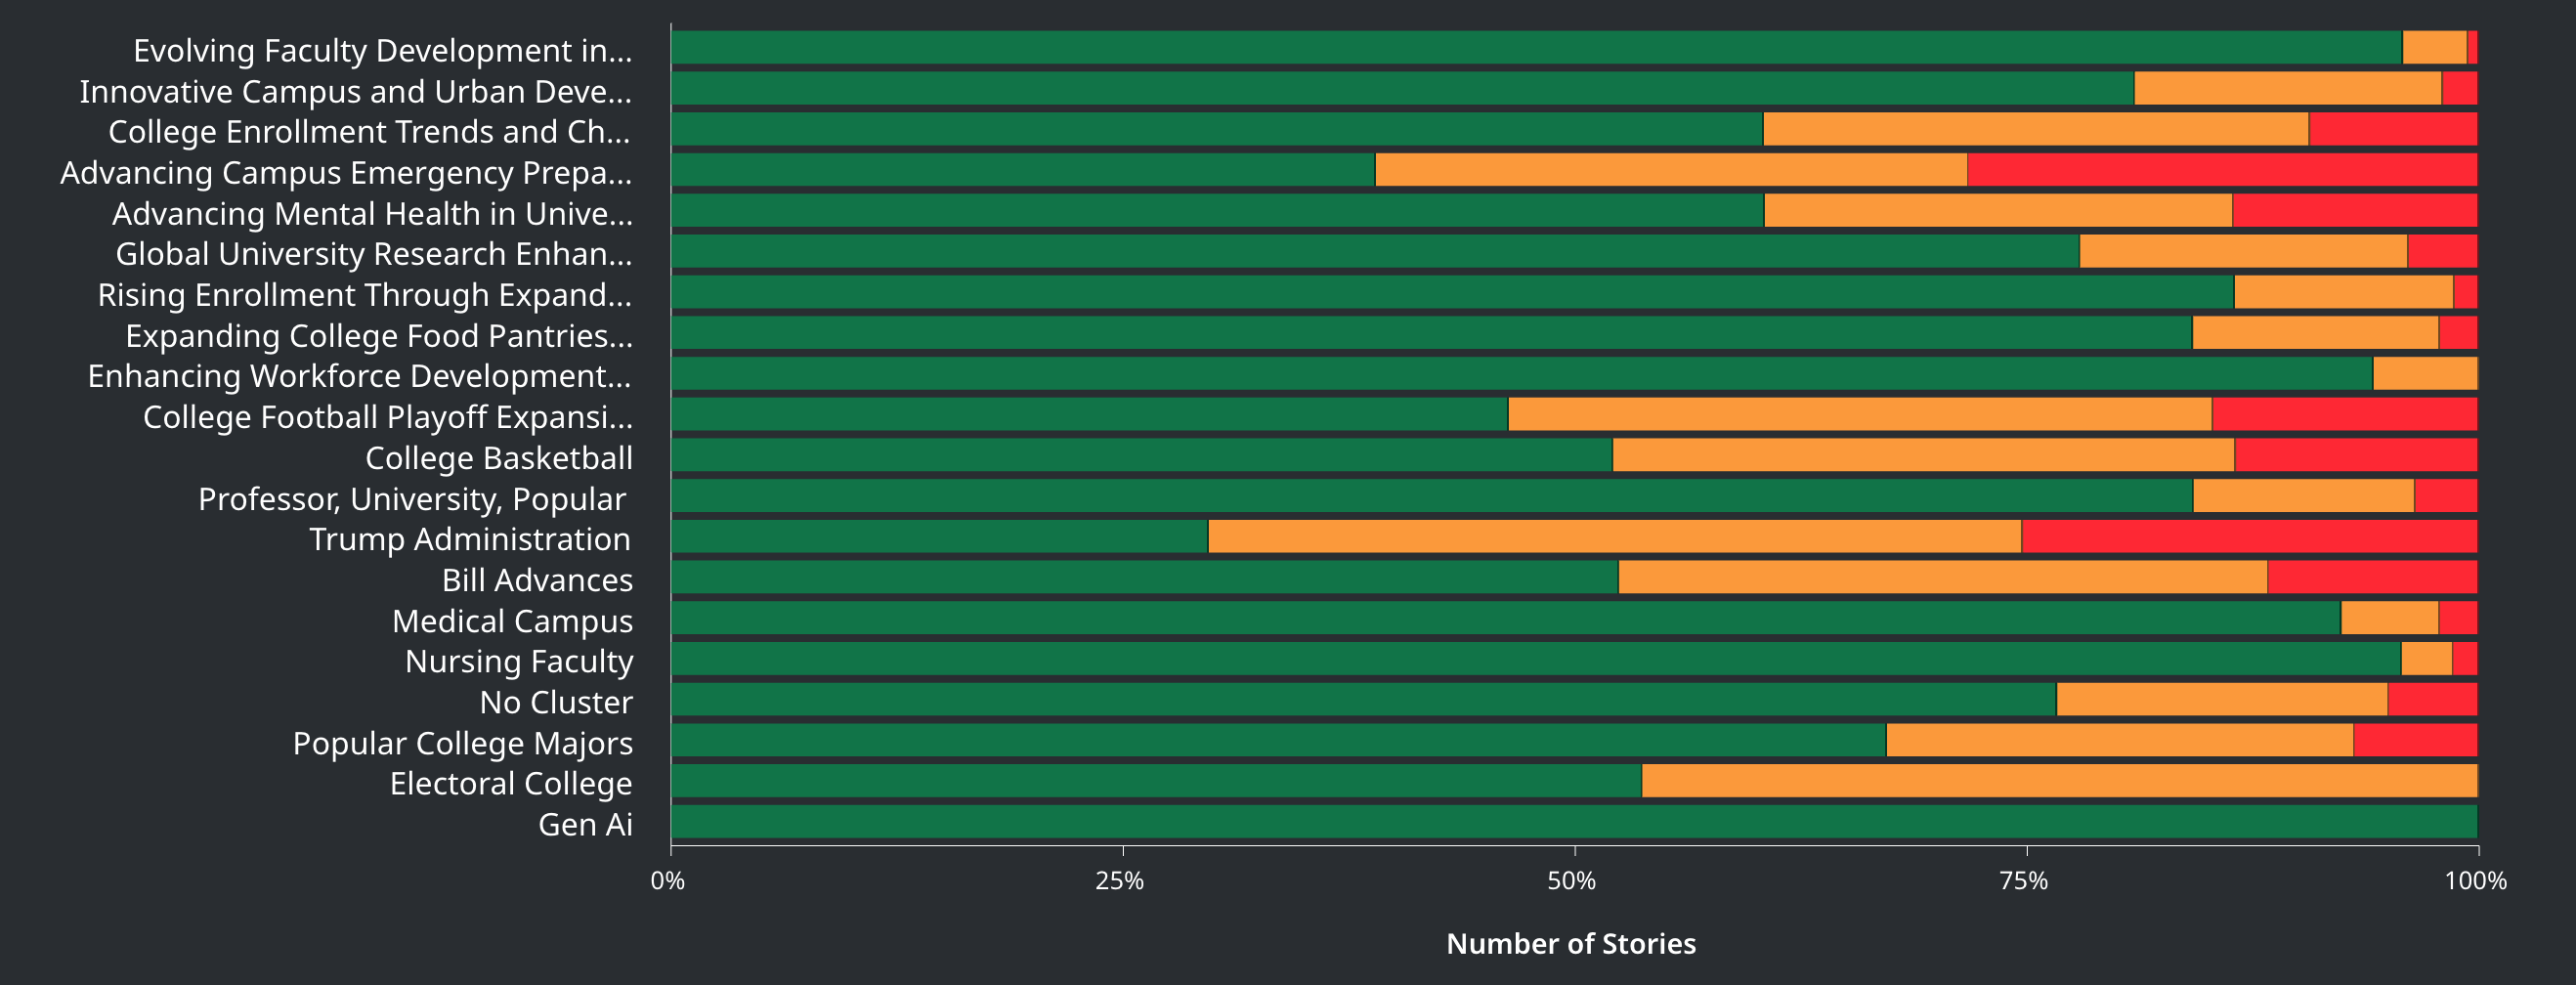
At the same time, clusters like advancing mental health (5.4%) and emergency preparedness (5.9%) reflect a strong focus on student wellbeing and safety; areas that have grown into defining themes for many institutions. And while athletics remain a dominant driver of public engagement, with college football playoff expansion surfacing as its own 4.5% cluster, other narratives such as sustainability research (5.1%) and workforce readiness (4.5%) show how universities are connecting their missions to societal impact.
On social platforms, the story looks different but complementary. Schools that embraced TikTok and student-led storytelling jumped 100+ places year-over-year in the rankings, while engagement with women’s health initiatives, campus expansion, and the economic value of a degree captured widespread attention in blog and news coverage.
Together, these signals create a more rounded picture of higher education today: one where growth and innovation sit alongside mental health, sustainability, and community impact — all shaping how institutions are seen and how they engage.
At first glance, a social media engagement report for universities might seem niche. But higher education offers one of the clearest views into how younger audiences connect online, making these findings valuable for anyone navigating today’s digital landscape.
By blending social channel data with Quid’s AI-driven context, this report is a lens into how digital communities evolve and how organizations can turn social signals into foresight.
Ready to see how Quid can help you stay ahead of the next wave of education trends? Let’s talk.