
It’s that time again. The 2026 Social Media Industry Benchmark Report is here.
It’s the same trusted benchmark report many marketers know from Rival IQ, now part of the Quid family. By bringing the report to Quid, we’re combining Rival IQ’s long-standing social benchmarking expertise with Quid’s broader AI-driven intelligence platform. The result is the same data-driven benchmark marketers rely on, now connected to deeper insights across markets, consumers, and emerging trends.
This year, the report is bigger and broader than ever. We’ve expanded to include new industries like Automotive, Aviation, Energy, Pharma, and Pets to the mix.
That means we’re now delivering key social media benchmarks and insights for 18 industries: Alcohol, Automotive, Aviation, Beauty, Energy, Fashion, Financial Services, Food, Higher Education, Hotels & Resorts, Influencers, Media, Nonprofits, Pets, Pharma, Retail, Sports, and Tech.
And for the first time, we’re introducing YouTube benchmarks alongside Facebook, Instagram, TikTok, and X, giving you a clearer picture of how long-form video stacks up against the rest of the social landscape.
Wondering if you’re posting enough? Posting too much? Or if your content is truly resonating? You’re not alone.
Once again, we analyzed millions of posts and billions of likes, comments, shares, and views to bring you the freshest social media benchmark data.
Let’s dive in and start benchmarking.
With a 2.01% engagement rate, TikTok once again topped every platform in the benchmark, outperforming Instagram, Facebook, and X by a wide margin.
After hitting a low of 0.015% in 2024, X engagement doubled to 0.03% in 2025, marking the platform’s first meaningful rebound in several years.
Brands publish almost twice as often on Instagram (3.7 posts per week) as they do on TikTok (2.0 videos per week), yet TikTok still generates dramatically higher engagement.
Energy and Pharma joined the benchmark report this year, and both quickly emerged as strong performers across several platforms with engagement rates above the median level across Facebook, Instagram, X, and TikTok.
A saturated market hurt Beauty & Retail, which had the lowest engagement across platforms.
This year’s benchmark reflects a broader data set. We introduced five new industries into the mix and while that expansion slightly shifts the median calculations, the overall trend remains clear.
TikTok continues to lead in audience interaction and engagement rates on the platform still far outpaces every other platform. Instagram continued its gradual decline, falling from 0.36% to 0.30%, a drop of roughly 17% year over year. Facebook remained flat, while X posted its first meaningful rebound after years of decline. And with YouTube entering the benchmark report for the first time, a new middle tier has emerged. It does not challenge TikTok, but it outperforms Facebook and X in engagement.

Posting frequency continued to slow across Instagram and Facebook this year, both reaching their lowest levels in the six-year view. Instagram dropped to 3.7 posts per week, while Facebook fell to just 3.0, a sharp pullback from last year.
X was the only legacy platform to edge upward, ticking up slightly from last year’s low. It is not a dramatic rebound, but it does suggest activity may be stabilizing after several years of steady decline.
TikTok held steady at 2.0 videos per week for the second year in a row, signaling consistency rather than aggressive expansion.

To see exactly how your industry compares across every platform, explore the full breakdown below.
Engagement on Facebook held steady this year, with several industries hovering right around the benchmark. Sports and Higher Education continued to lead, and notably, Energy made a strong debut as one of the top-performing industries in its first year in the report. On the other end of the spectrum, Retail and Tech remained at the bottom of the pack.

Brands continued to ease up on Facebook posting this year, with the all-industry median settling just under three posts per week. Most industries clustered close to that mark, signaling a more measured approach to content cadence.
Media once again dominated in volume, publishing at a pace far beyond every other industry, while Sports also maintained a notably high output. On the other end, industries like Alcohol, Energy, and Food posted far less frequently, staying well below the median.
Overall, Facebook activity looks more intentional than expansive. Outside of a few high-volume players, most brands appear to be pacing themselves rather than pushing maximum output.

Instagram engagement slipped again this year, with the all-industry median settling at 0.30%. While a handful of industries continue to outperform, most are operating in a tighter engagement band than in previous years.
Higher Education and Sports once again led the pack, both posting engagement rates well above the median. Energy, once again, made a strong debut in its first year in the report. On the other end, Retail and Beauty remained near the bottom, struggling to break out in an increasingly crowded feed.

For the second year in a row, median posting frequency on Instagram declined, settling at 3.69 posts per week. Most industries hovered close to the median, either holding steady or trimming their cadence slightly. Media, Sports, Beauty, and Retail remained the most active by a wide margin, while Energy and Pharma posted far less frequently in comparison.

X engagement rebounded this year, with the all-industry median doubling from 0.015% to 0.03%. After several years of steady decline, the platform showed its first meaningful lift.
Industries like Sports, Automotive, Aviation, and Influencers led the way, while Beauty and Retail continued to lag near the bottom. Media remained one of the lowest performers despite high posting volume.

Posting leveled out this year, with the all-industry median settling at 2.24 posts per week. After several years of steady pullback, most industries appear to have found a more sustainable cadence rather than continuing to scale down.
Media and Sports remained the most active by a wide margin, dramatically outpacing every other industry. Meanwhile, Retail, Pets, and Alcohol posted well below the median, keeping activity relatively light.

TikTok engagement softened again this year, with several industries pulling back from last year’s highs. Fashion and Influencers landed below the all-industry median, while others saw more modest shifts.
Even so, with a median engagement rate of 2.01%, TikTok continues to outperform every other major platform by a wide margin. Pharma, Higher Education, Alcohol, and Energy all posted standout results, proving that while the peak may have cooled, TikTok remains the strongest channel for driving audience interaction.

TikTok posting held relatively steady this year, with the all-industry median landing at 1.98 videos per week. While most industries clustered close to that benchmark, a few stood out.
Media once again dominated in volume, publishing far more frequently than any other category. Sports and Retail also remained highly active, both well above the median. On the other end of the spectrum, industries like Alcohol and Pharma posted more conservatively.

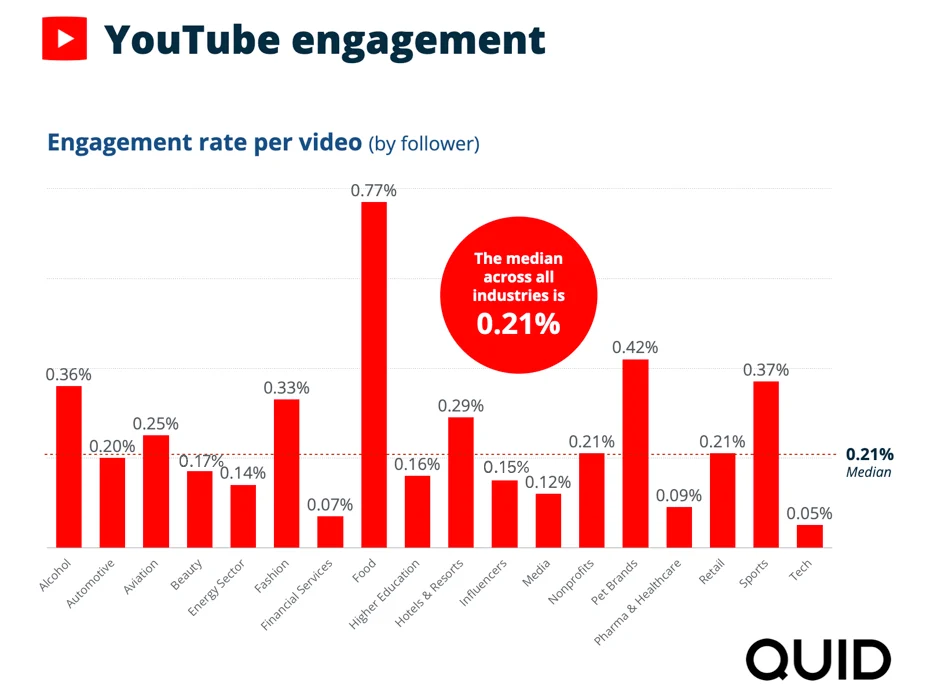
YouTube makes its debut in this year’s report, and early analysis show a median engagement rate of 0.21% across industries.
Food stands out immediately, posting the highest engagement rate by a wide margin. Pets and Sports also performed well above the median, while Alcohol and Fashion showed solid results in the mid range. On the other end of the spectrum, Tech and Financial Services trailed behind, suggesting YouTube audiences may be more selective in those categories.
While it is still early days for cross industry comparison, YouTube’s entry adds an important new layer to the benchmark conversation. Even at launch, several industries are already seeing meaningful engagement on the platform.
Sports and Media are leading the charge, publishing far more frequently than any other category. Tech also sits above the median, while Influencers land right around it. Most remaining industries are posting more conservatively, with categories like Alcohol, Food, and Pets averaging fewer than one video per week.

While platform trends tell one part of the story, the real insights emerge when you zoom in by industry.

Some industries continue to lead across multiple channels. Sports remains one of the most aggressive and engaged categories overall, with high posting frequency and strong engagement on nearly every platform. Higher Education and Influencers also consistently outperform benchmarks, particularly on Instagram and TikTok.
Meanwhile, the performance of new industries like Energy and Pets adds important context, especially as brands in these spaces continue to refine their social strategies.
Other industries show more mixed results. Retail and Fashion, for example, remain highly active but face engagement pressure on certain platforms. Financial Services and Tech tend to post more conservatively, with steadier but lower engagement rates overall.
To see how your specific industry stacks up across every platform, explore the full industry breakdown below:
This year’s report was produced using Quid’s Q Agents, which helped analyze and synthesize millions of social media interactions across platforms. Q Agents accelerate large-scale data analysis by surfacing patterns, summarizing insights, and helping identify meaningful benchmarks across industries. This allowed our team to move beyond raw metrics and focus on the trends that matter most.
To spot trends and identify benchmarks, we analyzed engagement rates, posting frequency, and audience metrics across the major social platforms: Facebook, Instagram, TikTok, X, and YouTube.
We define engagement as measurable interaction on social media posts, including likes, comments, favorites, reposts, shares, reactions, and video interactions. Engagement rate is calculated by dividing total interactions by follower count.
Within this report, we provide a representative sample of organic and paid posts from national and international companies in each industry by selecting 150 companies at random from each industry in our database of over 200,000 companies. Median performance from the companies selected for each industry was used to compile the benchmarks presented in this report.
Social media success is about so much more than getting the most comments or likes: it’s about increasing engagement while also growing or maintaining the percentage of your audience that engages as you expand your audience.
To us, engagement rate per post is the metric because it controls for post volume and audience size and helps marketers understand how they’re doing in relation to their competitors.
Why can’t you gauge success on likes alone? Because audience size is hugely important: 1,000 likes makes a huge difference to a brand with 2,000 followers, but is a drop in the bucket to a brand with 100,000 followers.
Benchmarking performance is only the first step. Acting on insights is where the real advantage begins.
Quid's Q Agents are the Consumer and Market Intelligence industry's largest library of AI agents, enabling teams to go beyond dashboards and static reports to automatically analyze massive volumes of market, consumer, and social data. Q Agents continuously monitor conversations, emerging trends, competitor activity, and shifting sentiment to surface the signals that matter most. Instead of manually digging through data, teams can deploy Q Agents to identify opportunities, track competitive movements, and detect market shifts in real time.
Another year, another shift in the social media landscape.
Let’s talk about how Quid can help you turn data into action.