

.png?width=1252&height=362&name=QUID_Logo_WHITE%20(2).png)
.png?width=1380&name=template%20even%20text%20(6).png "<span id=\"hs_cos_wrapper_name\" class=\"hs_cos_wrapper hs_cos_wrapper_meta_field hs_cos_wrapper_type_text\" style=\"\" data-hs-cos-general-type=\"meta_field\" data-hs-cos-type=\"text\" >Labor Day Loyalty: How Do Workers Really Feel About Brand-Led Tributes?</span>")
Labor Day gives brands a predictable moment to recognize workers. But before deciding what that recognition should look like, marketers need to understand what workers and consumers are saying.
Quid can help answer that question by moving beyond individual posts and examining patterns across a much larger conversation. For this analysis, Labor Day conversation data provides the quantitative view, while media coverage and TikTok conversations add context around how worker recognition, commercialization and brand-led tributes are being discussed.
Together, those signals reveal a Labor Day conversation with enormous potential reach but surprisingly little overt emotional expression.
Labor Day generated 468.4K mentions and 465.5K posts in the Quid dataset covering May 2024 through August 2026.
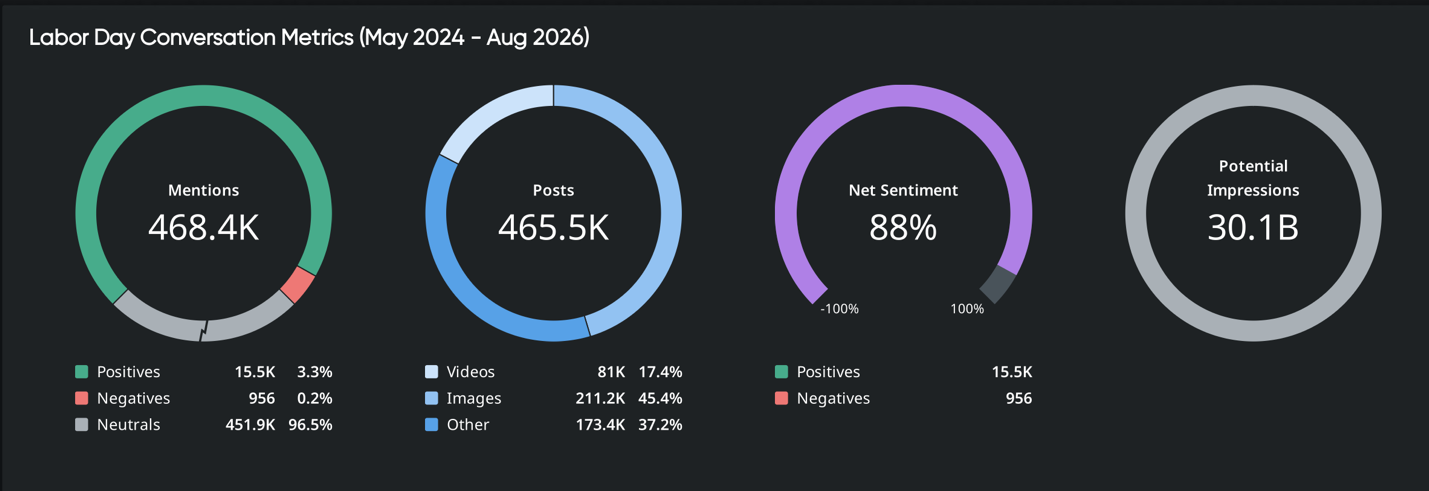
Quid Monitor lets analysts define a topic and apply filters so they can collect and examine relevant conversations together. Instead of treating a handful of posts as representative, the resulting dataset provides a broader view of conversation volume, content type, and sentiment.
Here, the scale is substantial. Labor Day conversation produced 30.1 billion potential impressions. Images accounted for 45.4% of posts, videos for 17.4%, and other content for 37.2%.
The sentiment distribution adds important context. Neutral mentions accounted for 96.5% of the conversation, compared with 3.3% positive and 0.2% negative. That means conversation volume alone cannot tell brands how people feel about the holiday. The next layer of analysis has to examine what people are doing and discussing.
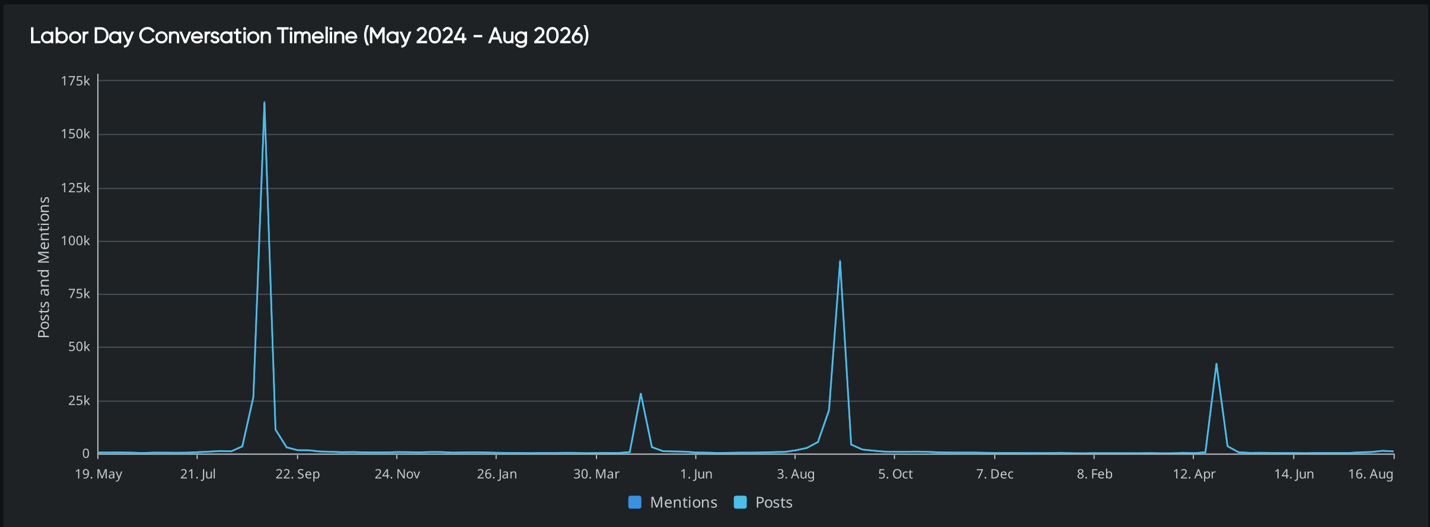
Labor Day conversation gains momentum in distinct spikes rather than maintaining the same level of attention throughout the year.
Quid’s timeline view makes those changes visible by plotting posts and mentions over time. For marketers, this matters because a trend line provides context that an isolated volume number cannot. Analysts can see when attention accelerates, when it falls away and whether a topic reflects sustained conversation or a time-specific surge.
The Labor Day timeline from May 2024 through August 2026 shows repeated periods of heightened activity around the holiday. That temporal context helps brands distinguish the broader Labor Day conversation from the moments when people are most actively contributing to it.
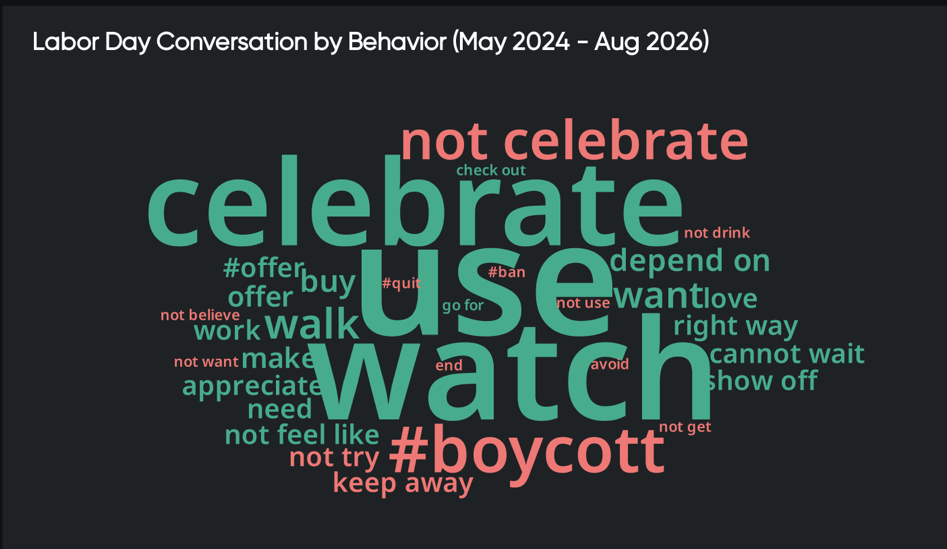
People discuss Labor Day through behaviors ranging from celebrating and working to buying, appreciating, boycotting, and choosing not to celebrate.
Quid’s behavioral analysis moves beyond raw mention counts by surfacing actions and expressions occurring within the conversation. In this dataset, prominent terms include “use,” “watch,” “celebrate,” “work,” “buy,” “offer,” “appreciate,” “#boycott” and “not celebrate.”
That mix is useful because it prevents a simplistic reading of Labor Day as one unified consumer occasion. Participants are celebrating, working, shopping or responding to offers. Others are expressing resistance or disengagement. For brands, those differences provide a more useful starting point than assuming everyone enters the holiday with the same expectations.
Workers in the TikTok dataset describe Labor Day through work, service and commitment rather than through brand recognition.
Qualitative analysis adds the context that aggregate metrics cannot provide on their own. Once Quid identifies patterns worth investigating, analysts can examine the underlying conversations to understand how people describe their experiences in their own words.
One worker discussing essential sectors, including nursing-home staff, says that “on holidays are the days we work the most.” The same conversation describes someone “who has no days off, who doesn’t want to take a break” and invites other workers to share “what you had to work on today.”
These examples do not establish how all workers feel about Labor Day. They do show how worker-generated conversation can frame the holiday very differently from a traditional brand tribute.For some of the workers represented in this dataset, Labor Day remains quite literally a day of labor.
Men contribute a larger share of posts, while women participate at a higher rate relative to the comparison benchmark.
Quid’s audience indexing helps distinguish audience size from disproportionate participation. That distinction matters because the group producing the most posts is not automatically the group for whom a topic is unusually relevant.
Men account for 55% of Labor Day posts in the dashboard but have an index of 0.82. Women account for 45% while indexing at 1.36.
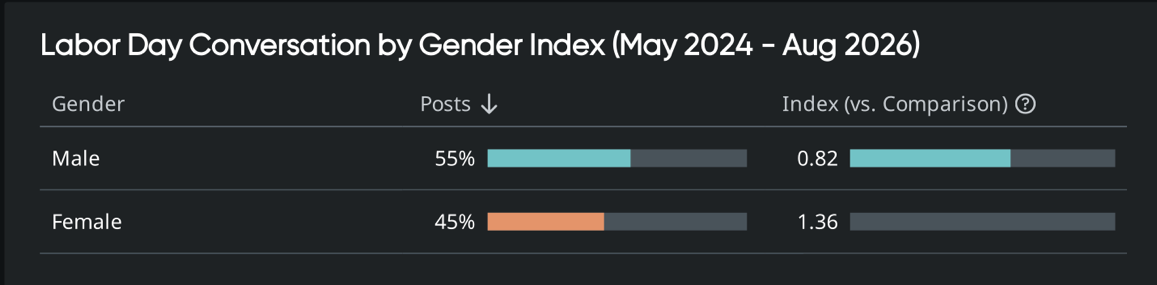
For marketers, the index adds another layer to the raw percentage. It shows how strongly a group participates relative to the comparison population rather than simply showing its share of the total conversation.
Labor Day conversation is distributed across age groups rather than being concentrated in a single generation. Quid’s age analysis allows marketers to compare both the percentage of conversation associated with an age group and that group’s index against the comparison population.
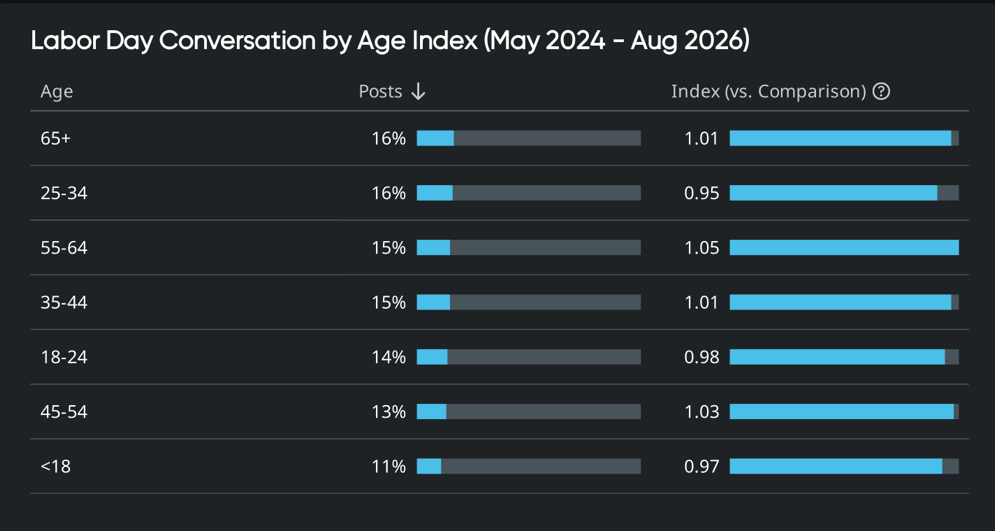
The dashboard shows relatively narrow differences across the age groups represented. Ages 65+ and 25–34 each account for 16% of posts, while other groups range from 11% to 15%. Their indices also remain relatively close to 1, ranging from 0.95 to 1.05.
For a brand, that finding changes the planning question. The challenge becomes understanding how different audiences engage with the same Labor Day conversation rather than assuming the holiday belongs primarily to one age cohort.
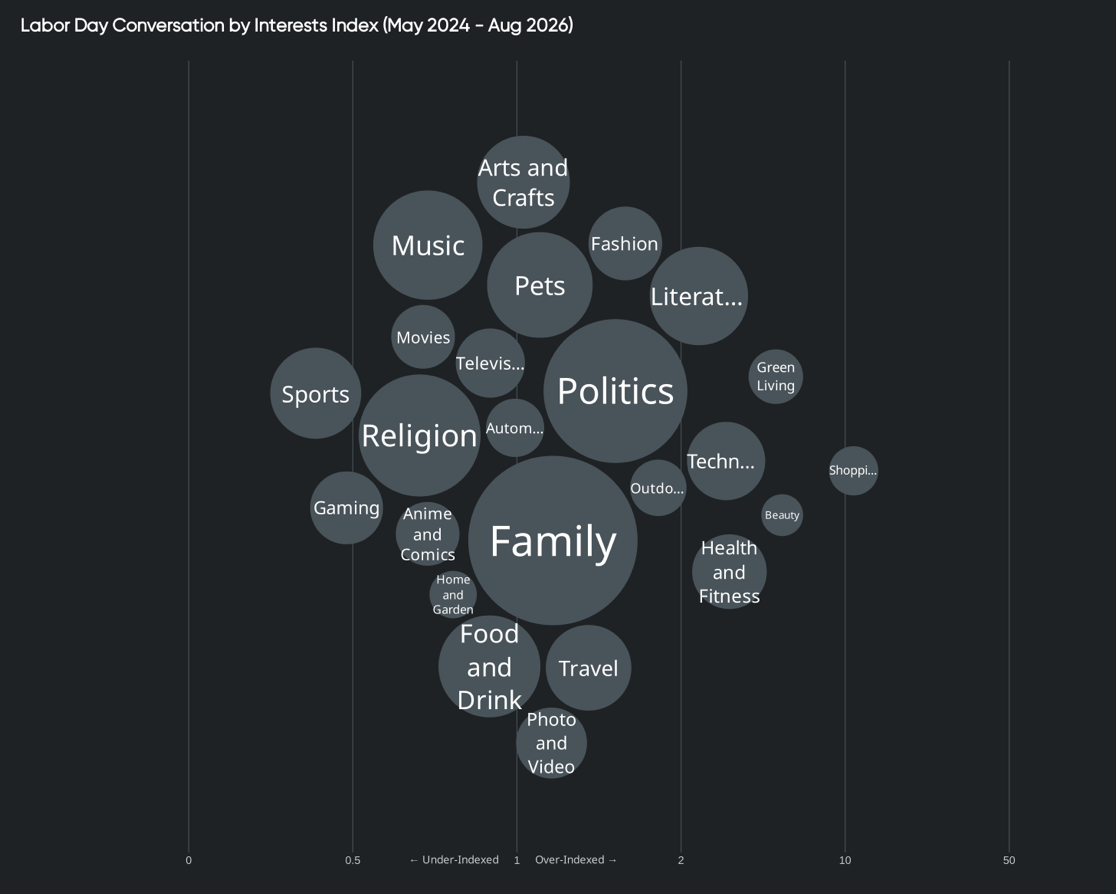
Labor Day conversation intersects with interests including family, politics, religion, music, food and drink, sports, travel, technology, shopping and other areas.
Quid’s interest indexing provides another way to understand the people behind the posts. Rather than looking only at what someone says about Labor Day, the analysis can show which interests are represented and whether they over- or under-index against a comparison audience. This gives marketers a broader picture of the audience surrounding a topic.
The value is methodological as much as descriptive. A conversation about Labor Day does not exist in a Labor Day-only universe. Participants bring other interests and contexts, and those connections can help brands understand where the conversation fits within a larger consumer landscape.
This is where Quid’s indexing becomes particularly useful. Manufacturing stands out most sharply by index, even though it represents less than 1% of posts in the profession analysis.
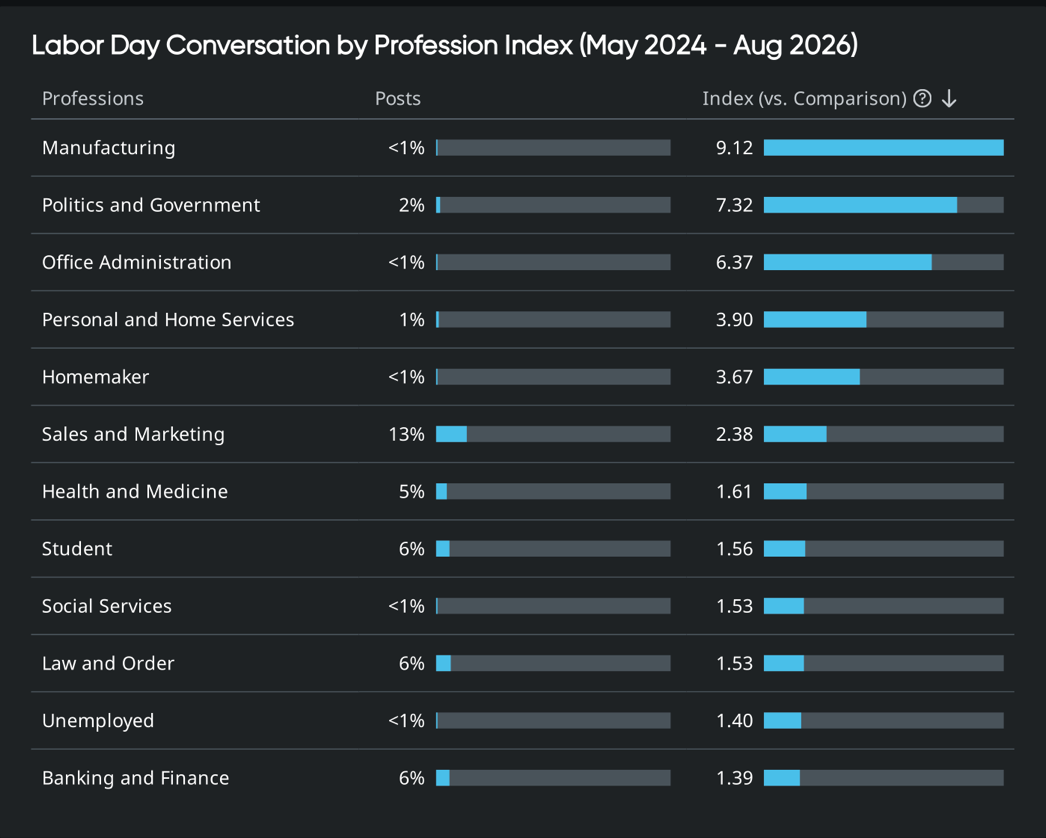
Manufacturing has an index of 9.12, politics and government 7.32, and office administration 6.37. By contrast, sales and marketing accounts for 13% of posts but has an index of 2.38. Those numbers answer two different questions.
Share of posts shows how much of the measured conversation comes from a group. Indexing shows whether that group appears more or less prominently than it does in the comparison population. Without both measures, marketers could easily overlook a small but highly over-indexed audience or overstate the importance of a large group simply because it produces more posts.
Labor Day conversation extends across every ethnicity represented in the dashboard, with relatively modest differences in indexing among most groups.
Quid’s ethnicity view adds another audience dimension to the analysis by comparing share of posts with an index against the comparison population.
The dashboard shows Caucasian audiences accounting for 34% of posts, African American audiences for 28%, Hispanic audiences for 15%, Asian audiences for 13%, Other for 6%, and American Indian or Alaskan Native audiences for 3%. The corresponding indices range from 0.84 to 1.07.
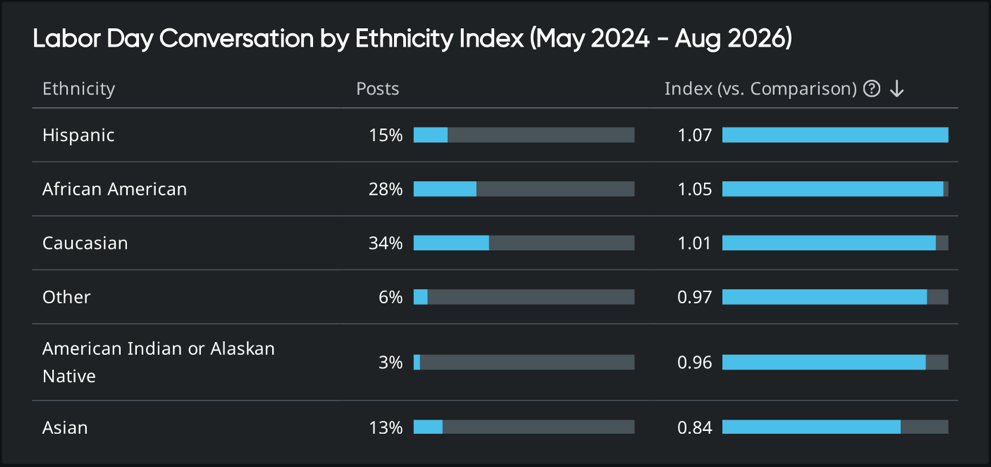
The finding does not tell brands what any ethnicity thinks about Labor Day. It shows the composition of the measured conversation and helps analysts avoid treating a large aggregate audience as though it were demographically uniform.
A brand-led tribute can attract skepticism when attention shifts from workers and their experiences toward commercialization, corporate benefit or the promotion itself.
This is where qualitative source analysis becomes particularly valuable. Aggregate sentiment tells analysts how much positive, negative or neutral conversation exists. Examining individual themes and source material helps explain what is producing those reactions.
In the TikTok dataset our Q Agent captured, satire targets holiday commercialization through a fictional “Meta Holiday Hype Collection.” The parody includes “Labor Day Spider Man,” reducing holiday marketing to an intentionally absurd collectible.
Media commentary provides another example. USA Today’s criticism of a corporate-funded road trip involving U.S. Transportation Secretary Sean Duffy and Rachel Campos-Duffy questioned the arrangement's financial benefit and the involvement of companies regulated by the Department of Transportation.
Neither example proves that consumers broadly reject branded Labor Day recognition. They identify specific conditions under which the gesture itself can become the story. Marketers take note!
Brands can use Quid to move from measuring Labor Day attention to understanding who participates, what they do, when conversation changes and which themes deserve closer investigation.
The process works in layers.
That progression shows that no single metric answers the entire business question, and the Labor Day data demonstrates the point particularly well. The conversation has 30.1 billion potential impressions, yet 96.5% of mentions are neutral. Worker posts emphasize service and working through the holiday. Satirical content questions commercialization. Audience data reveals meaningful differences between share of conversation and audience indexing.
Taken together, those findings give marketers something more useful than a declaration that Labor Day sentiment is “good” or “bad.” They provide a way to see the conversation, investigate what is driving it, and make a more informed decision about how a brand should participate.
Quid offers brands a nuanced, contextualized understanding, and this is the new competitive advantage. Reach out to learn more.
How does Quid identify consumer trends?
Quid identifies consumer trends by analyzing large volumes of structured and unstructured data and helping analysts surface patterns, themes and changes within that information.
Why does Quid use both volume and indexing?
Volume and indexing answer different audience questions: volume shows how much conversation a group contributes, while indexing shows how strongly that group appears relative to a comparison population.
Why is qualitative analysis still important?
Qualitative analysis provides the context behind quantitative patterns by allowing analysts to examine the conversations, themes and source material contributing to those patterns.
What does neutral sentiment mean in this Labor Day analysis?
Neutral sentiment means that 96.5% of the Labor Day mentions in this dataset were classified as neutral rather than positive or negative; it does not establish why individual participants were neutral.
What should brands take from the Labor Day findings?
Brands should use the findings to understand the context surrounding Labor Day before determining how to participate, particularly the distinction between broad visibility, audience composition, worker experiences and react