

.png?width=1252&height=362&name=QUID_Logo_WHITE%20(2).png)

Key takeaways:

What the chief executive of a company chooses to post publicly is one of the clearest signals you can get about where that business is putting its attention, and it's been one of the hardest things to track at scale. Following a handful of CEOs is manual work. Following an industry's worth of them, or comparing what executives across twenty sectors are emphasizing this quarter, hasn't really been practical at all.
Fortune 1000 CEOs on LinkedIn changes that. It's a certified dataset in Quid that gathers LinkedIn content from Fortune 1000 chief executives, tags every post with the company and industry behind it, and makes the whole thing queryable through Ask Q and Q Agents.
A dataset is the body of text your questions run against inside Quid Terminal. A certified dataset is one Quid builds and maintains for you, rather than one your team defines and validates itself.
It sits in the Dataset Library alongside your own datasets, stays current on its own, and is ready to question the moment you open it. You don't configure anything.
The dataset covers 1,083 Fortune 1000 companies and identifies 1,094 CEO names across them. Of those, 874 have LinkedIn profiles, and 705 are posting content that flows into the topic.
That last number is worth sitting with. Roughly seven hundred of the most senior executives in American business are publishing their thinking publicly, on a regular basis, in a format that's fully analyzable. That's a substantial body of primary-source executive commentary, and until now there's been no straightforward way to read it collectively.
Content runs from January 1, 2016 to the present, so you can look at a single quarter or trace how a theme has developed across nearly a decade.
Every post carries structured metadata, which is what turns a pile of LinkedIn content into something you can actually analyze:
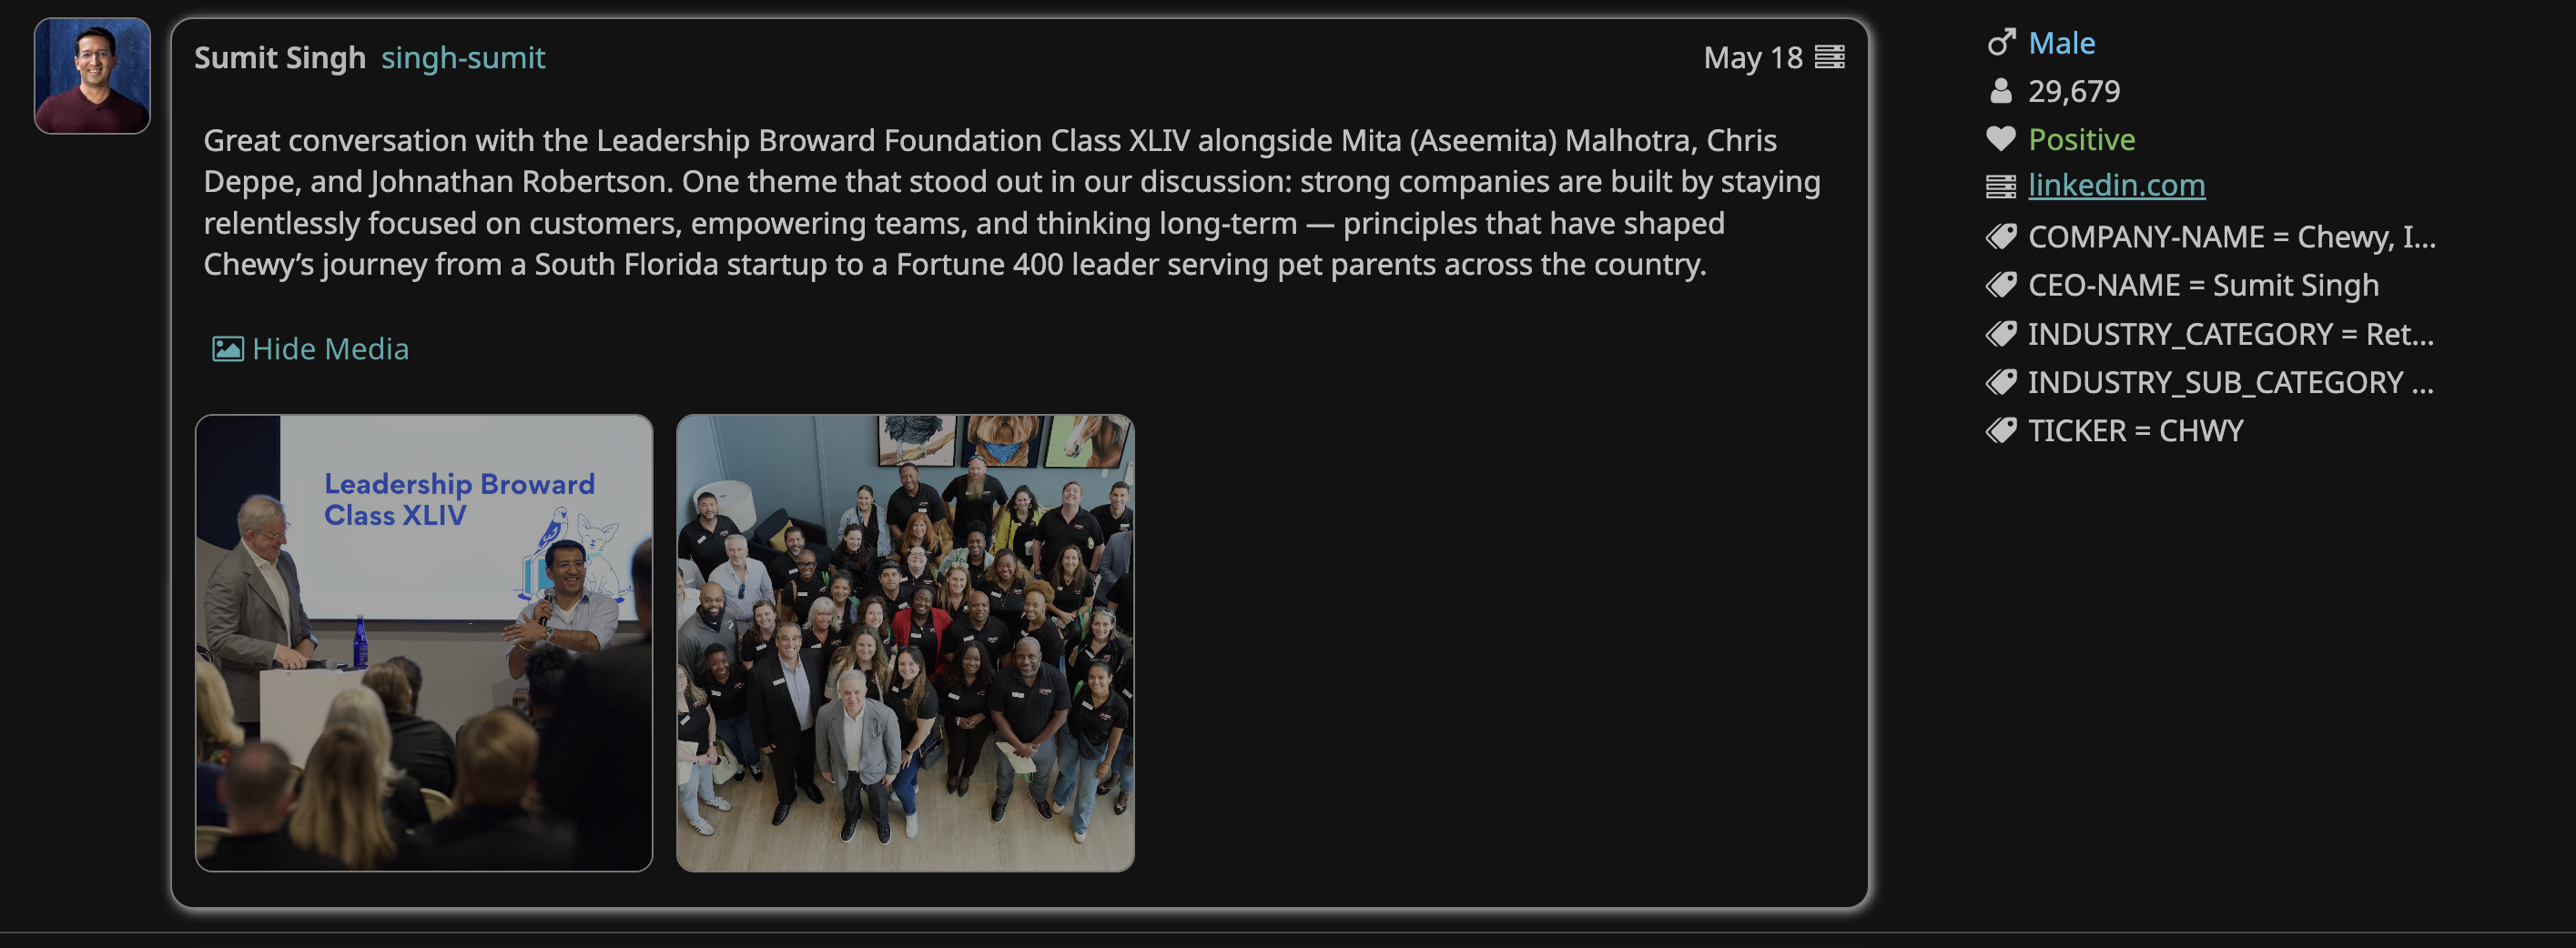
The industry tagging spans 20 top-level categories, from Aerospace & Defense and Chemicals through Financials, Healthcare, Technology, Retail, and Transportation, broken into 63 sub-categories underneath them. Companies that operate across more than one sector are tagged for each.
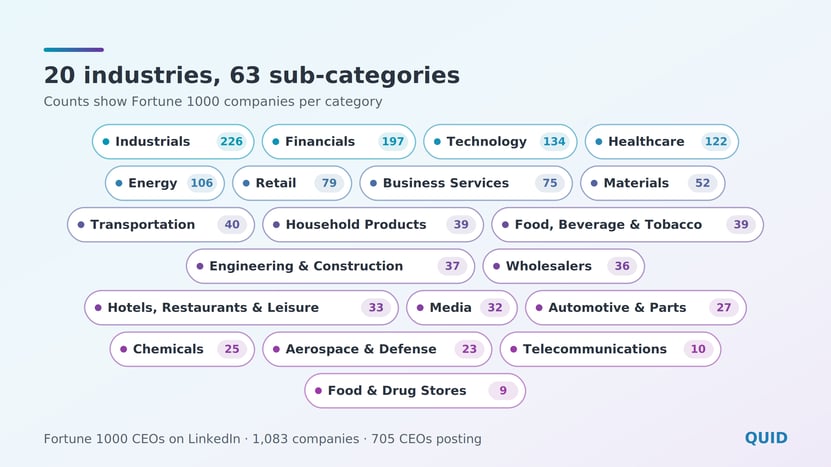
So you can narrow to the eleven CEOs in a specific sub-category, pull an entire industry, compare two sectors against each other, or follow one executive by name or ticker. The filtering is what makes it useful at scale, because "what are CEOs talking about" is a much less interesting question than "what are CEOs in my category talking about, and how has that shifted since last year."
Benchmark your own executive communications. If your CEO posts on LinkedIn, you can see how their themes, volume, and engagement compare with peers in the same sub-category rather than against a general sense of what good looks like.
Track where an industry's attention is moving. Chief executives tend to talk publicly about what they're prioritizing internally. Reading an entire sector's worth of that commentary together surfaces the themes gaining traction at the top of your category, often before they show up in earnings coverage or trade press.
Watch how competitors are positioning. A competitor's CEO posting repeatedly about supply chain resilience, or AI investment, or a particular market, tells you something about where the company is heading, straight from the person setting the direction.
Prepare for the room. Before a pitch, a partnership conversation, or a board meeting, a read of what that company's chief executive has been emphasizing publicly is the fastest available briefing on what they care about right now.
Compare across sectors. Because the industry tagging is consistent, you can put twenty categories side by side and see which themes are universal and which are specific to one corner of the market.
LinkedIn content is pulled weekly, so the dataset keeps pace with what's being posted.
The CEO list itself is refreshed monthly. When a new chief executive is detected, their historical posts are backfilled into the topic, which means a leadership change doesn't leave a gap. You get the full posting history of the incoming CEO rather than just what they've published since taking the role.
The dataset appears in your Dataset Library, and from there you can question it directly through Ask Q by asking in plain language what themes a given industry's executives are raising, or how a company's CEO commentary has changed over a period.
You can also point Q Agents at it to produce briefs on a schedule, so a quarterly read of your sector's executive conversation arrives without anyone having to remember to run it.
And because every post keeps its source and metadata, any finding traces back to the specific executive, company, and post it came from.
Executive thought leadership has always been a useful signal and an awkward one to work with, because it's scattered across a thousand individual feeds with no structure connecting them.
Fortune 1000 CEOs on LinkedIn gives that signal a shape: every post attached to a company, an industry, and a ticker, covering nearly a decade, updated weekly, and ready to question the moment you open it.
Fortune 1000 CEOs on LinkedIn is available now as a certified dataset in Quid Terminal. Want to see what you can pull from it? Request a free demo.
It's a certified Quid dataset that automatically collects and organizes LinkedIn content posted by the chief executives of Fortune 1000 companies, tagging each post with company, CEO, industry, sub-category, and ticker so the content can be filtered and analyzed.
The dataset spans 1,083 Fortune 1000 companies and 1,094 identified CEOs. Of those, 874 have LinkedIn profiles and 705 are actively posting content captured in the topic.
Content runs from January 1, 2016 to the present, and you can apply your own date range or theme filters to narrow it.
LinkedIn content is pulled weekly and the CEO list is updated monthly. When a new CEO is identified, their historical posts are backfilled so the record stays complete through leadership changes.
Yes. Every post is tagged with an industry category and sub-category, covering 20 top-level industries and 63 sub-categories, so you can analyze a single sector, compare several, or follow an individual company by name or ticker.