


Key takeaways:
A trend with a million views and a trend with a million views and a flood of comments underneath are not the same trend, and until now Quid Trends could only show you the first half of that. Average engagement is now in the side panel, so reach and reaction sit next to each other.
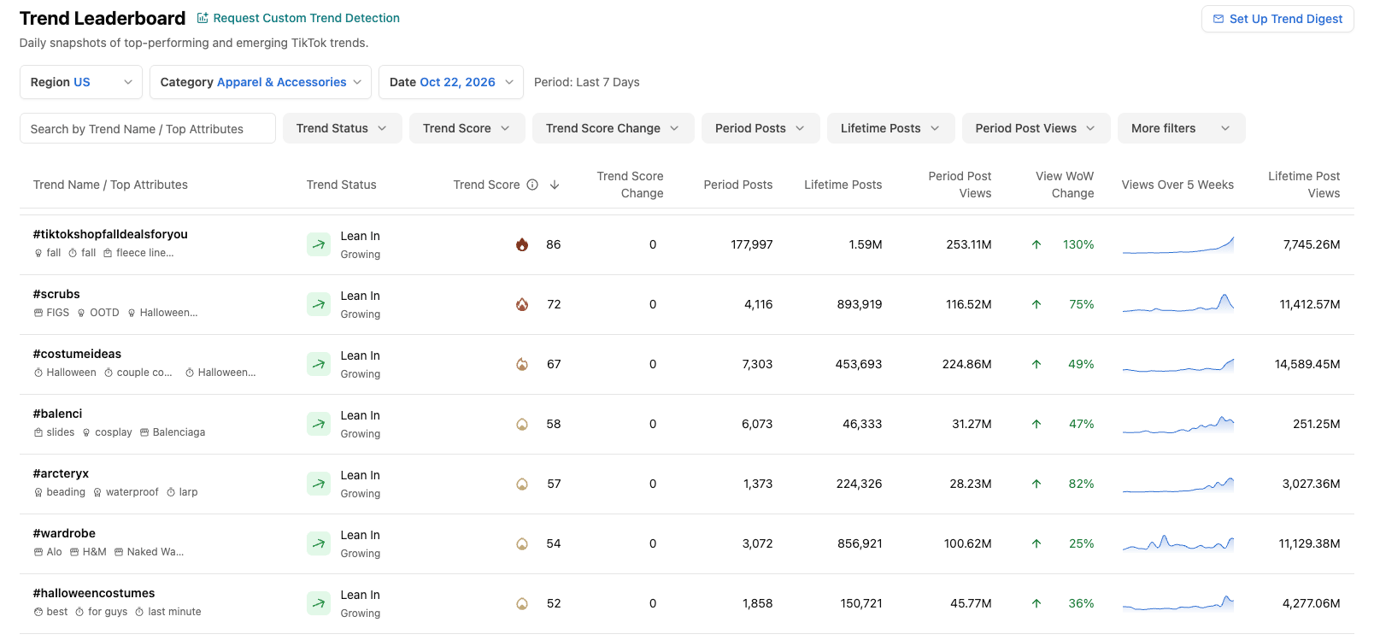
Quid Trends is the leaderboard of what is moving right now. It pulls directly from TikTok, scores and ranks trends by momentum, and keeps itself current, so opening it shows you what is rising today rather than what was rising when somebody last ran a report.
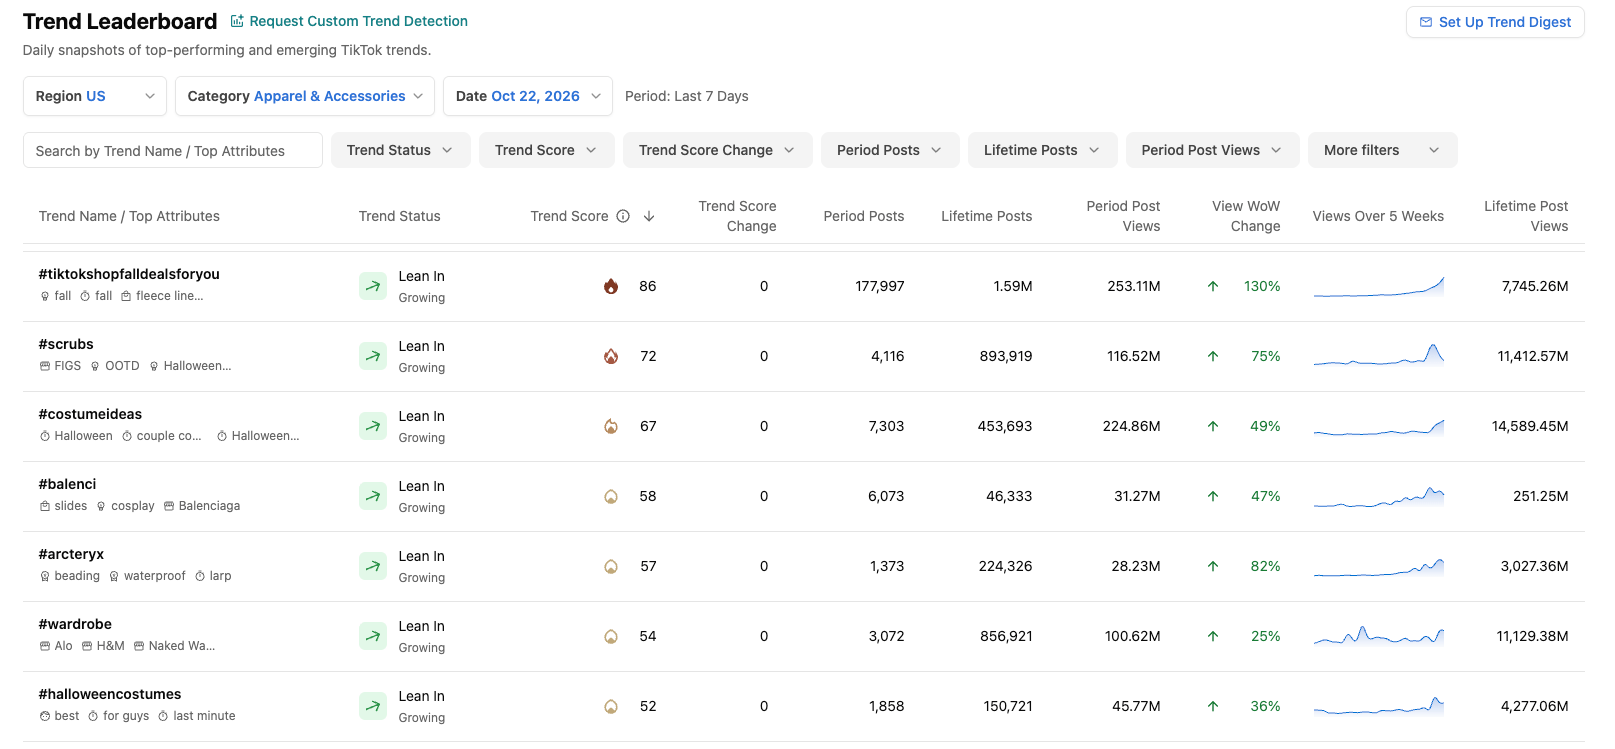
Trends are organized by category, which is what makes it usable rather than merely interesting. You can narrow to beauty, food, apparel, health or whichever category you work in and see what is climbing there specifically, rather than scrolling a general list of whatever is loudest on the platform. Selecting any trend opens a side panel with its detail: its Trend Score, how its views have moved week over week, and the posts carrying it.
The point of all that is timing. Knowing a trend exists is worth something, and knowing it is accelerating in your category this week is worth considerably more, because the window where a brand can do anything useful with a trend is usually short.
Views tell you how many people a trend reached. They do not tell you whether anybody cared.
Engagement is the closer proxy for that. A trend where people are commenting, sharing and reacting is one where an audience has decided the subject is worth participating in, and that is a different signal from one where a lot of people scrolled past. Both are worth knowing, and seeing them together is what makes either useful: high reach with low engagement suggests something that travelled on the algorithm, while high engagement against more modest reach suggests a smaller audience that genuinely cares, which is frequently the more actionable of the two.
For anyone deciding whether to act on a trend, that distinction matters. A trend that people are participating in supports a brand joining the conversation. A trend people merely watched supports very little.
Engagement figures arrive for a sample of the posts in a trend, not all of them, so the side panel reports the average engagement across that sample.
There is deliberately no topline total in the main view, because a total built from a sample would describe the sample rather than the trend, and would read as though it described the whole thing. An average across a sample is a fair representation of how posts in that trend tend to perform. A sum of the same sample would just be a smaller number than the truth, presented as if it were the truth.
That is worth stating plainly rather than quietly, since the honest version of a metric is the one you can make decisions against.
This is a small addition and a useful one. Reach and engagement answer different questions, the second is usually the one that decides whether a trend is worth acting on, and both now sit in the same panel.
Average engagement is live in Quid Trends now. Want to see what is climbing in your category? Request a free demo.
The Trends side panel shows average engagement for a trend, displayed alongside the Trend Score, week over week view change and the posts behind the trend.
Engagement data is available for a sample of the posts in a trend rather than every post. An average across that sample fairly represents how posts in the trend tend to perform, while a total would describe only the sample while appearing to describe the whole trend.
Reach is how many people saw a trend, and engagement is how many did something about it by commenting, sharing or reacting. A trend with high reach and low engagement travelled on distribution, while strong engagement against modest reach points to an audience that genuinely cares.
Select any trend in the leaderboard and the side panel opens with its detail, including average engagement. No setup or configuration is required.
