

.png?width=1252&height=362&name=QUID_Logo_WHITE%20(2).png)
.png?width=1380&name=template%20even%20text%20(14).png "<span id=\"hs_cos_wrapper_name\" class=\"hs_cos_wrapper hs_cos_wrapper_meta_field hs_cos_wrapper_type_text\" style=\"\" data-hs-cos-general-type=\"meta_field\" data-hs-cos-type=\"text\" >Which Back-to-School Products Broke Through This Year?</span>")
Back-to-school season puts very different products in competition for consumer attention. A backpack may become a school essential. Headphones can become a study tool, while skincare, hydration products and small appliances can become part of new routines. That creates opportunities across categories, but it also makes attention harder to interpret.
A product can appear to break through for very different reasons. High conversation volume can come from consumers, news coverage, retailers, promotions or discussions only loosely connected to the product itself. Understanding what is behind that attention gives brands a clearer picture of how a product is really showing up in the market.
To see those differences in action, Quid analyzed five cross-industry product conversations from August 18 through September 17, 2026. The analysis looks beyond the topline numbers to examine the themes, sources and consumer reactions shaping the conversation around each product.
What is back-to-school market intelligence?
Back-to-school market intelligence analyzes consumer conversations, media coverage, competitive activity and emerging trends surrounding the seasonal shopping period.
Why should brands track back-to-school conversations?
Conversation analysis can reveal which products, needs and use cases are attracting attention as consumers establish new school-year routines.
What does share of voice tell brands?
Share of voice measures how much of a defined conversation belongs to a brand, topic or narrative. In this analysis, Quid reports narrative share of voice, which measures the relative size of themes within each individual product conversation.
Does high conversation volume mean high sales?
No. Conversation volume measures discussion within the analyzed dataset. It does not establish sales, conversion or product demand.
Why does conversation source matter?
News, retailer content, social posts and community discussions can generate different types of attention. Looking at the source helps brands understand what is driving the conversation.
Rather than compare products from a single category, the analysis looks at five ways brands can enter back-to-school and college routines:
The five Quid analyses cover the same August 18 through September 17 period. That gives us a consistent window, but the metrics require some care.
The reports also do not provide a standardized overall sentiment score across all five datasets. Where positive reactions, skepticism or criticism appear, this analysis uses those specific signals rather than creating an unsupported sentiment ranking.
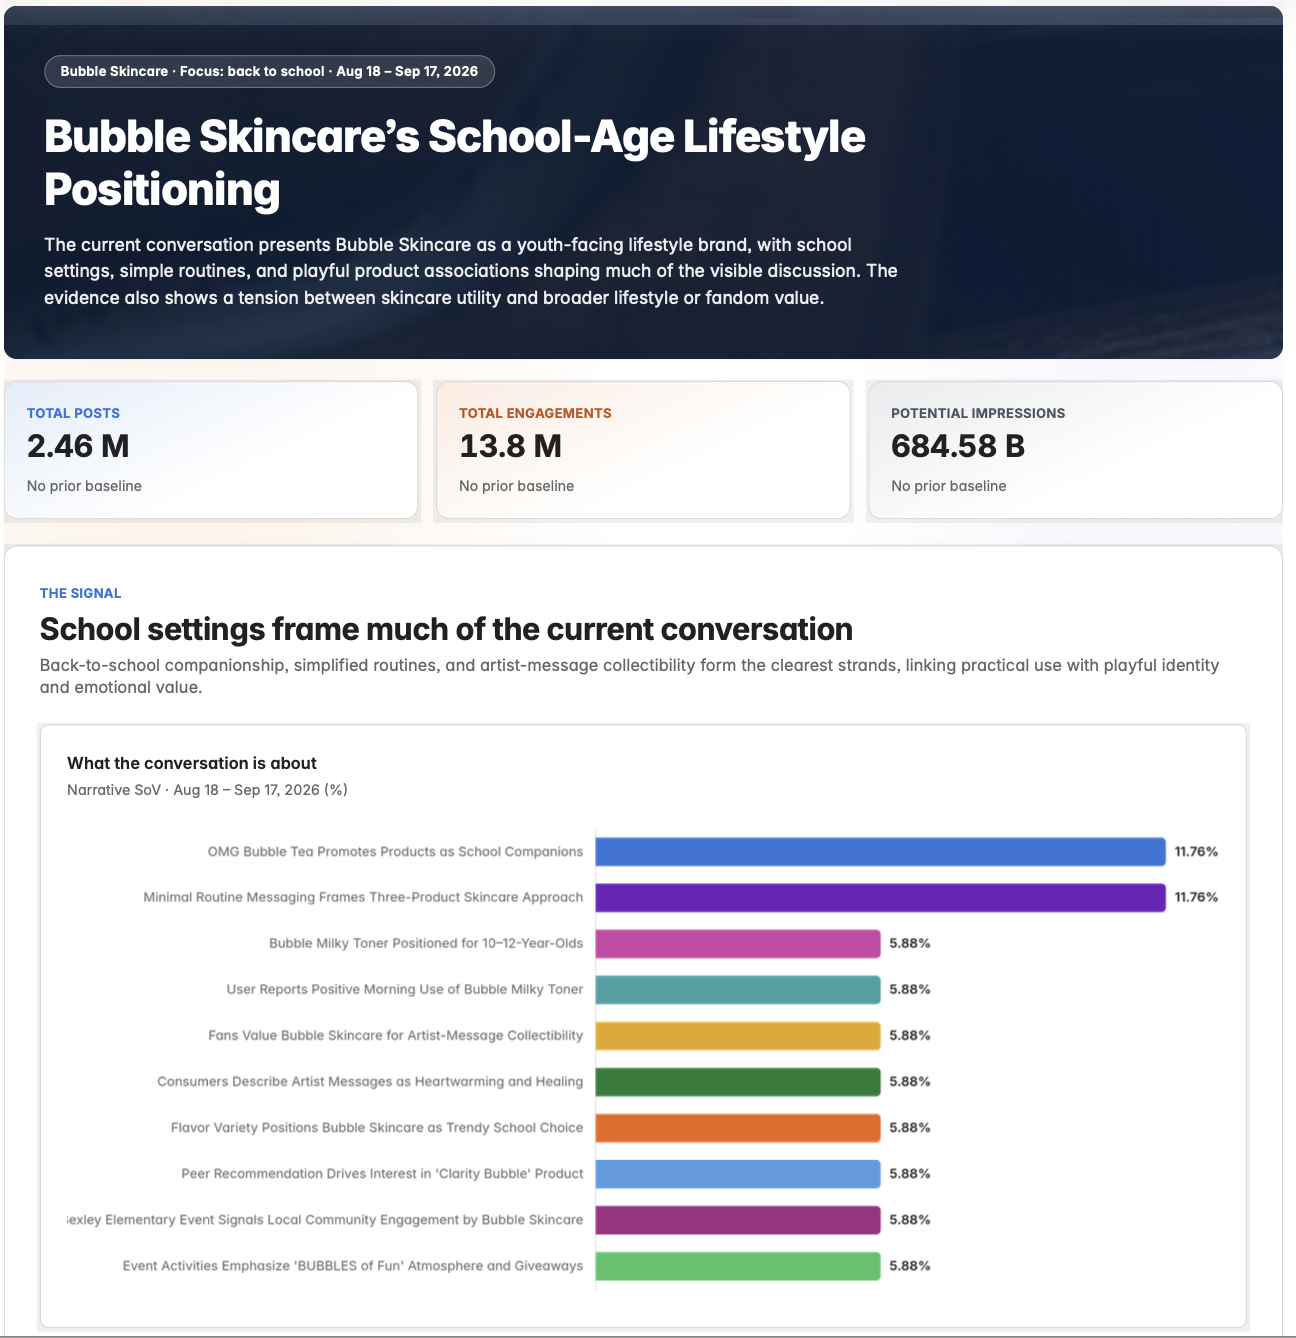
Bubble Skincare’s back-to-school conversation shows skincare becoming part of school-day routines. One of the largest narratives, representing 11.76% of narrative share of voice, centered on a minimal three-product skincare routine. The conversation emphasized simplicity and products that could fit easily into a morning routine.
Other themes add to that picture. Consumers discussed positive morning use of Bubble Milky Toner, while peer recommendations helped generate interest in specific products. School settings also appeared directly in the conversation through community events and product positioning aimed at younger consumers.
The Bubble conversation suggests that relevance can come from showing where a product fits within an existing routine, especially when simplicity, everyday use and recommendations from others are already part of how consumers discuss it.
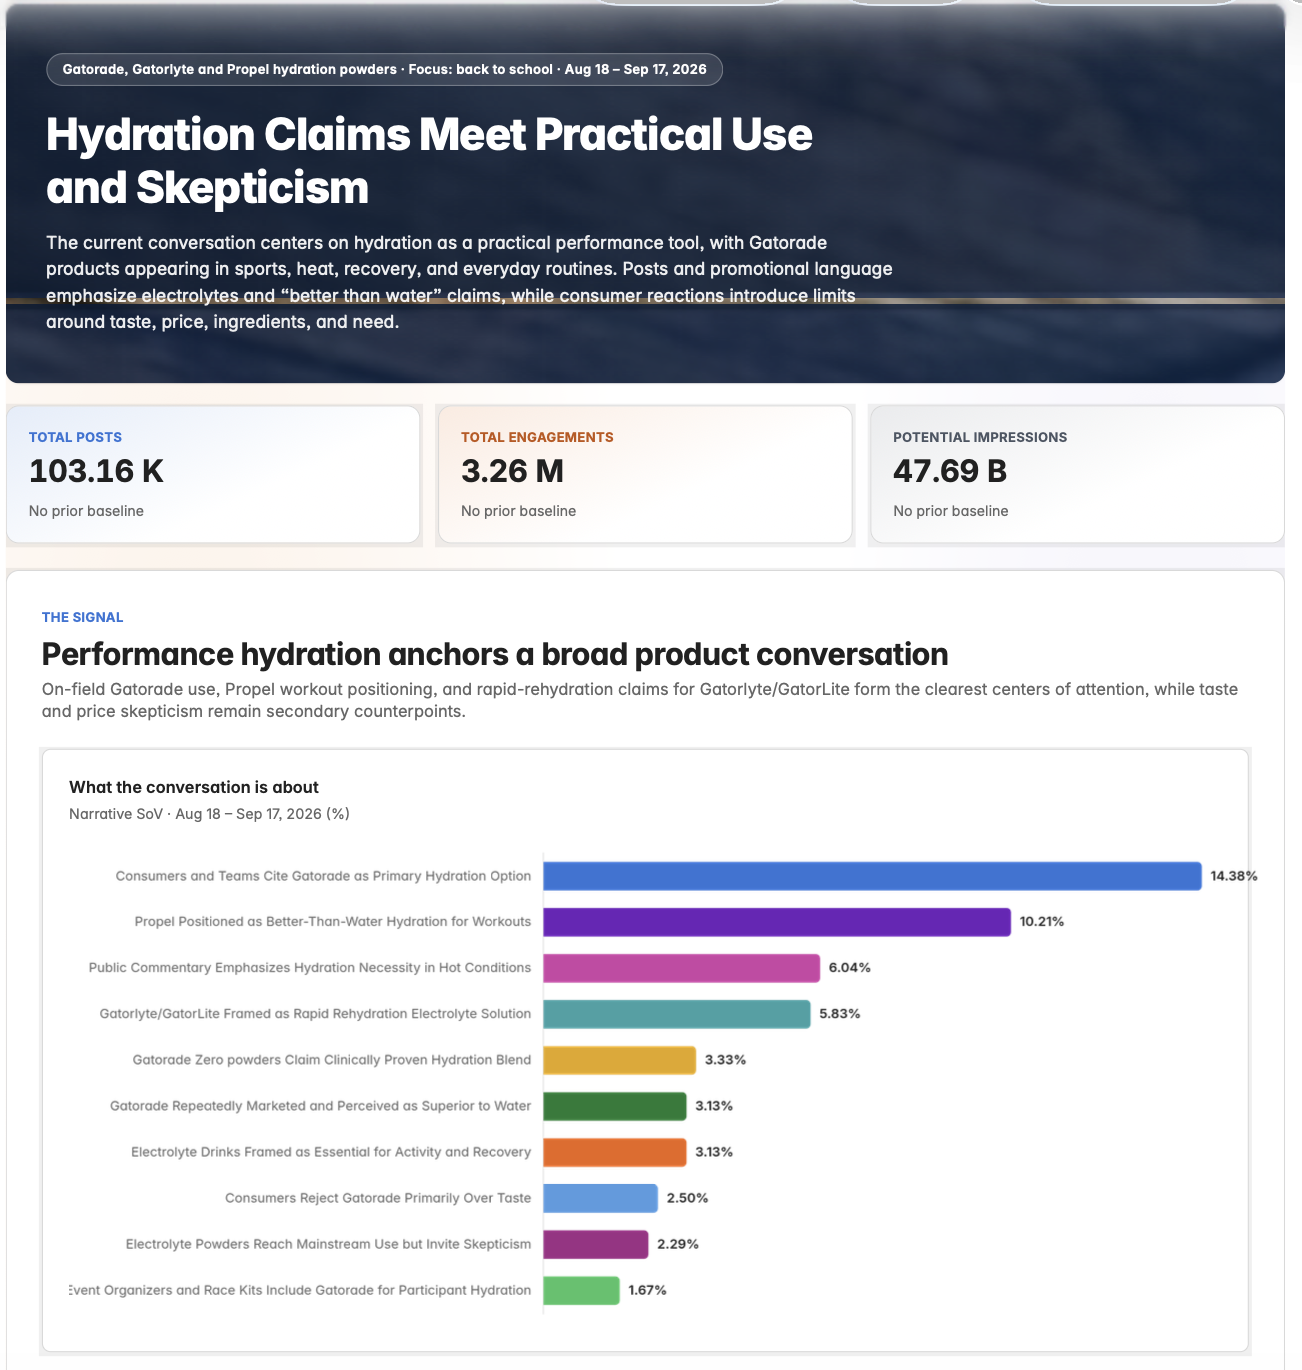
Gatorade, Gatorlyte and Propel generated 103.16 thousand posts, 3.26 million engagements and 47.69 billion potential impressions. The conversation centered on hydration as a practical performance tool, with products appearing across sports, heat, recovery and everyday routines.
That attention was not uniformly positive. The analysis also surfaced taste, price, ingredient and necessity concerns. This creates a more useful signal for brands: consumers were discussing recognizable use cases while also questioning when electrolyte products were necessary and whether specific products delivered enough value.
X generated 66.2% of analyzed posts, followed by Reddit at 11.1% and news at 7.9%. That source mix provides additional context around the scale of the conversation.
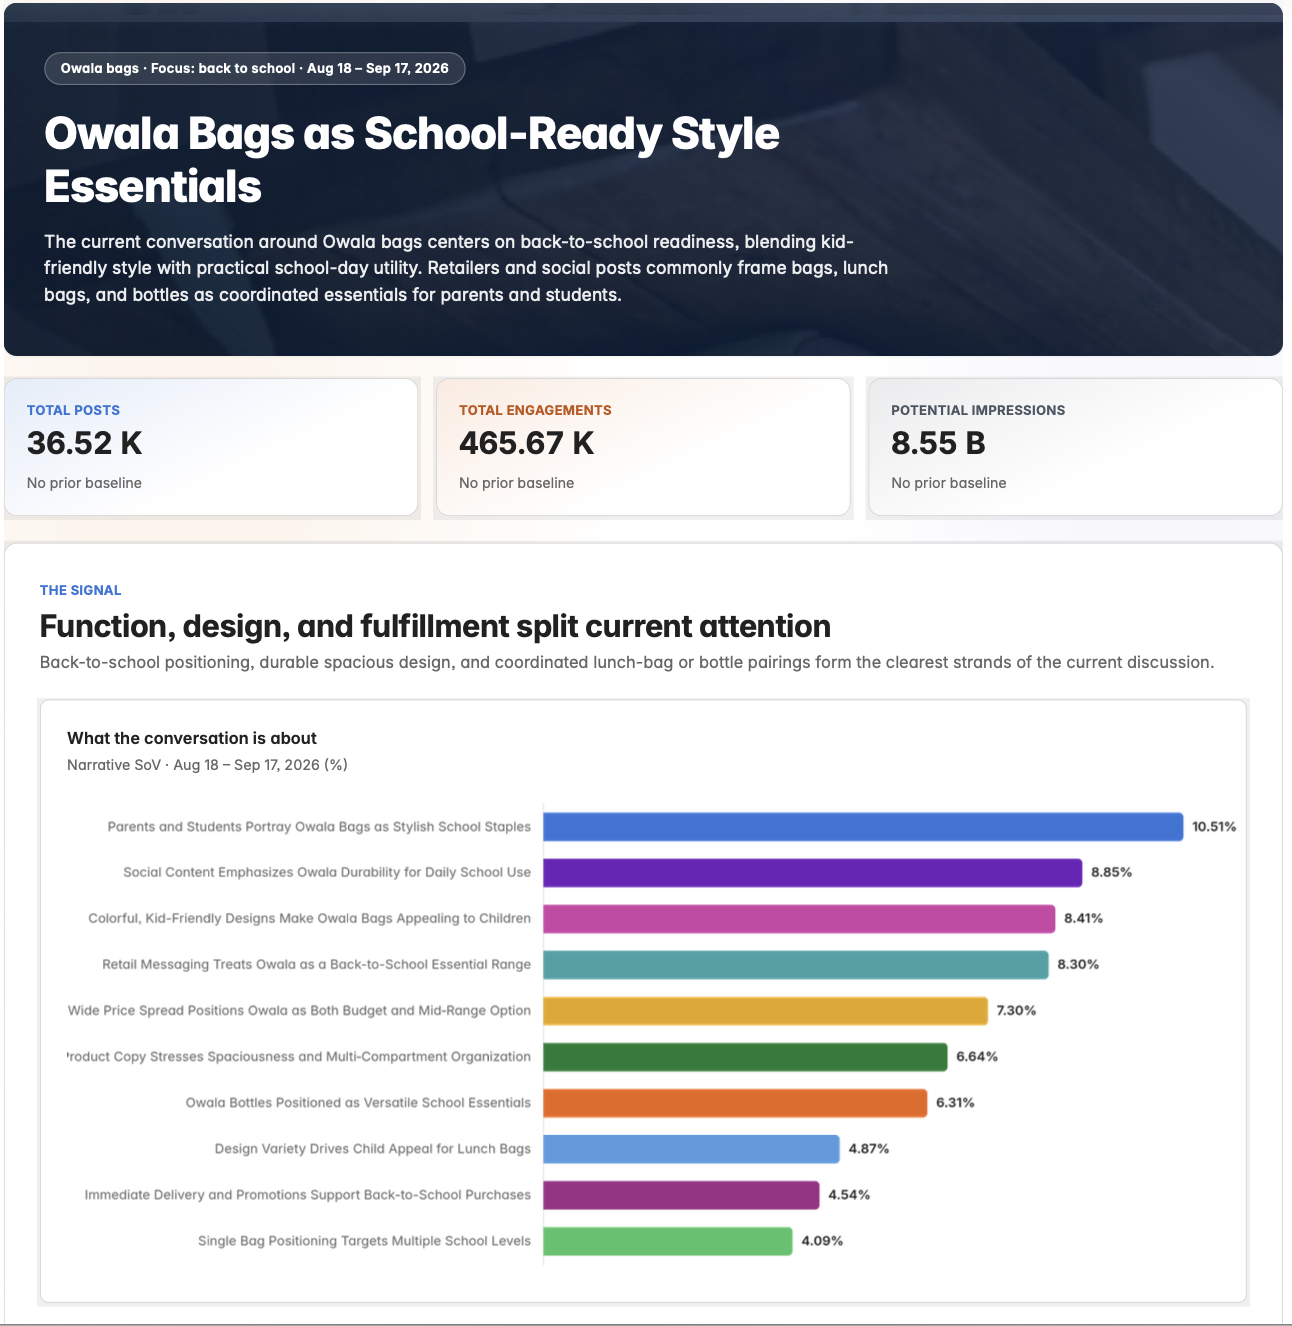
Owala generated 36.52 thousand posts, 465.67 thousand engagements and 8.55 billion potential impressions. Here, the connection to back-to-school was especially direct: function, design and coordinated school essentials formed the clearest themes.
Parents and students portraying Owala bags as stylish school staples represented 10.5% of narrative SoV. Durability for daily school use accounted for 8.85% and colorful, kid-friendly designs another 8.41%. Retail messaging treating Owala as part of a broader back-to-school essentials range represented 8.30%.
Owala also had a relatively distributed source mix. Instagram accounted for 37.3% of analyzed posts and X for 36.9%, followed by news at 7.2% and Reddit at 6.7%.
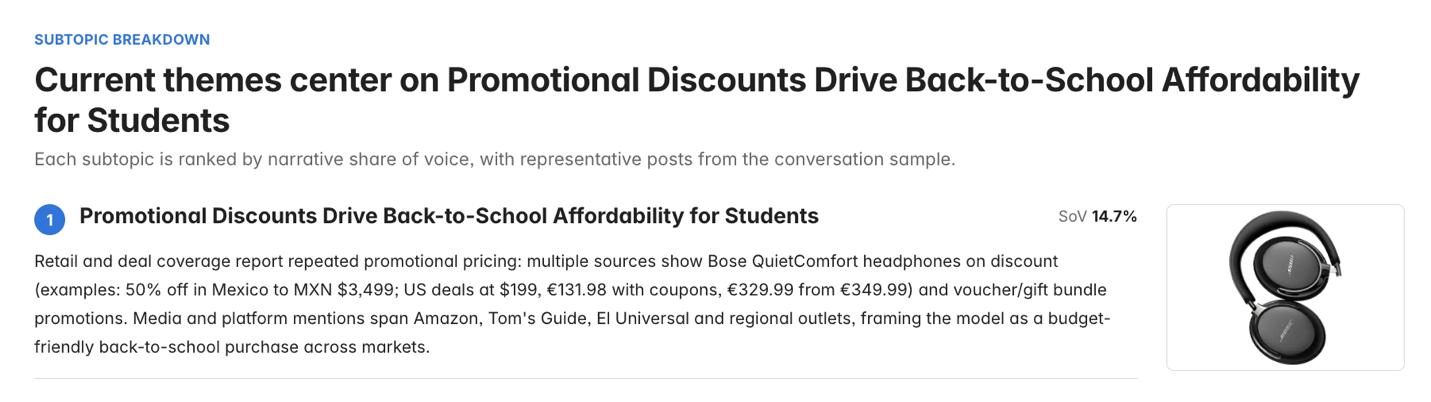
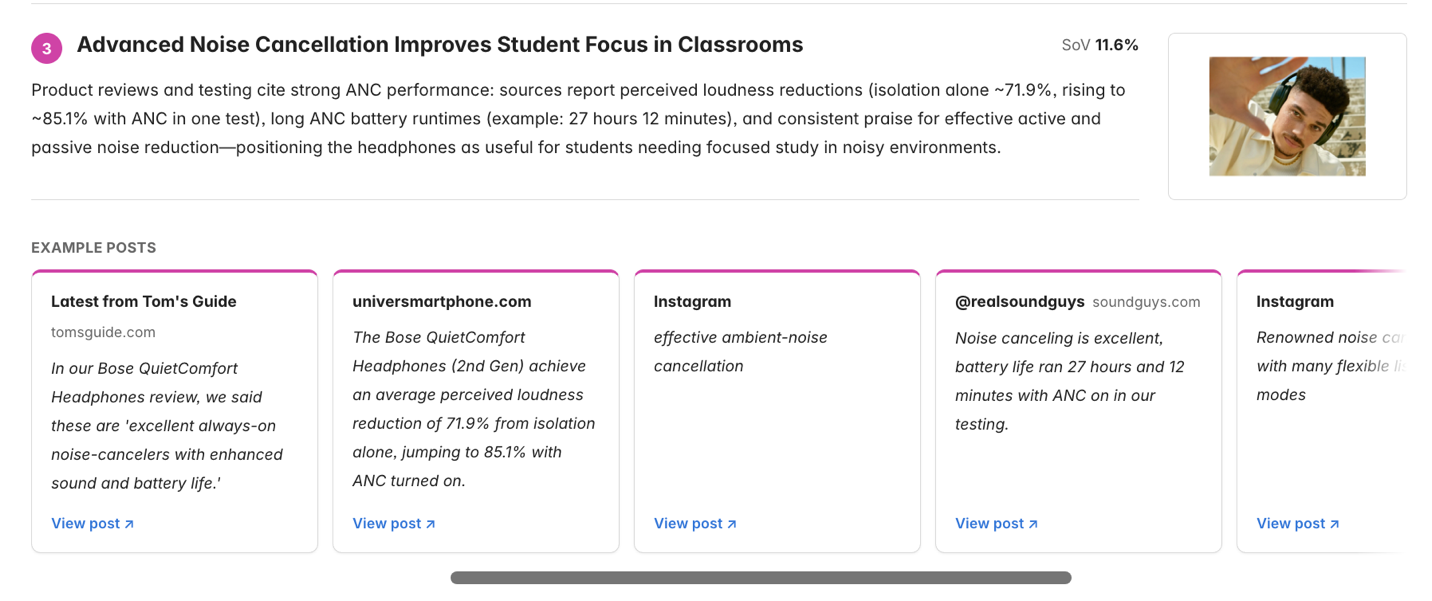
Bose QuietComfort generated 14.68 thousand posts, 28.14 thousand engagements and 1.06 billion potential impressions. Its leading themes centered on practical purchase considerations: deals, long-wear comfort and noise cancellation.
Promotional discounts represented 14.73% of narrative SoV, followed closely by comfort at 14.59%. Noise cancellation accounted for 11.55%, while comfort for extended study and commute use represented another 10.81%.
The source mix adds an important qualification. X generated 58% of analyzed posts and news another 18.5%, while Reddit accounted for 8.7%. The data supports strong visibility around specific student-relevant benefits and promotions, but it does not establish purchase demand.
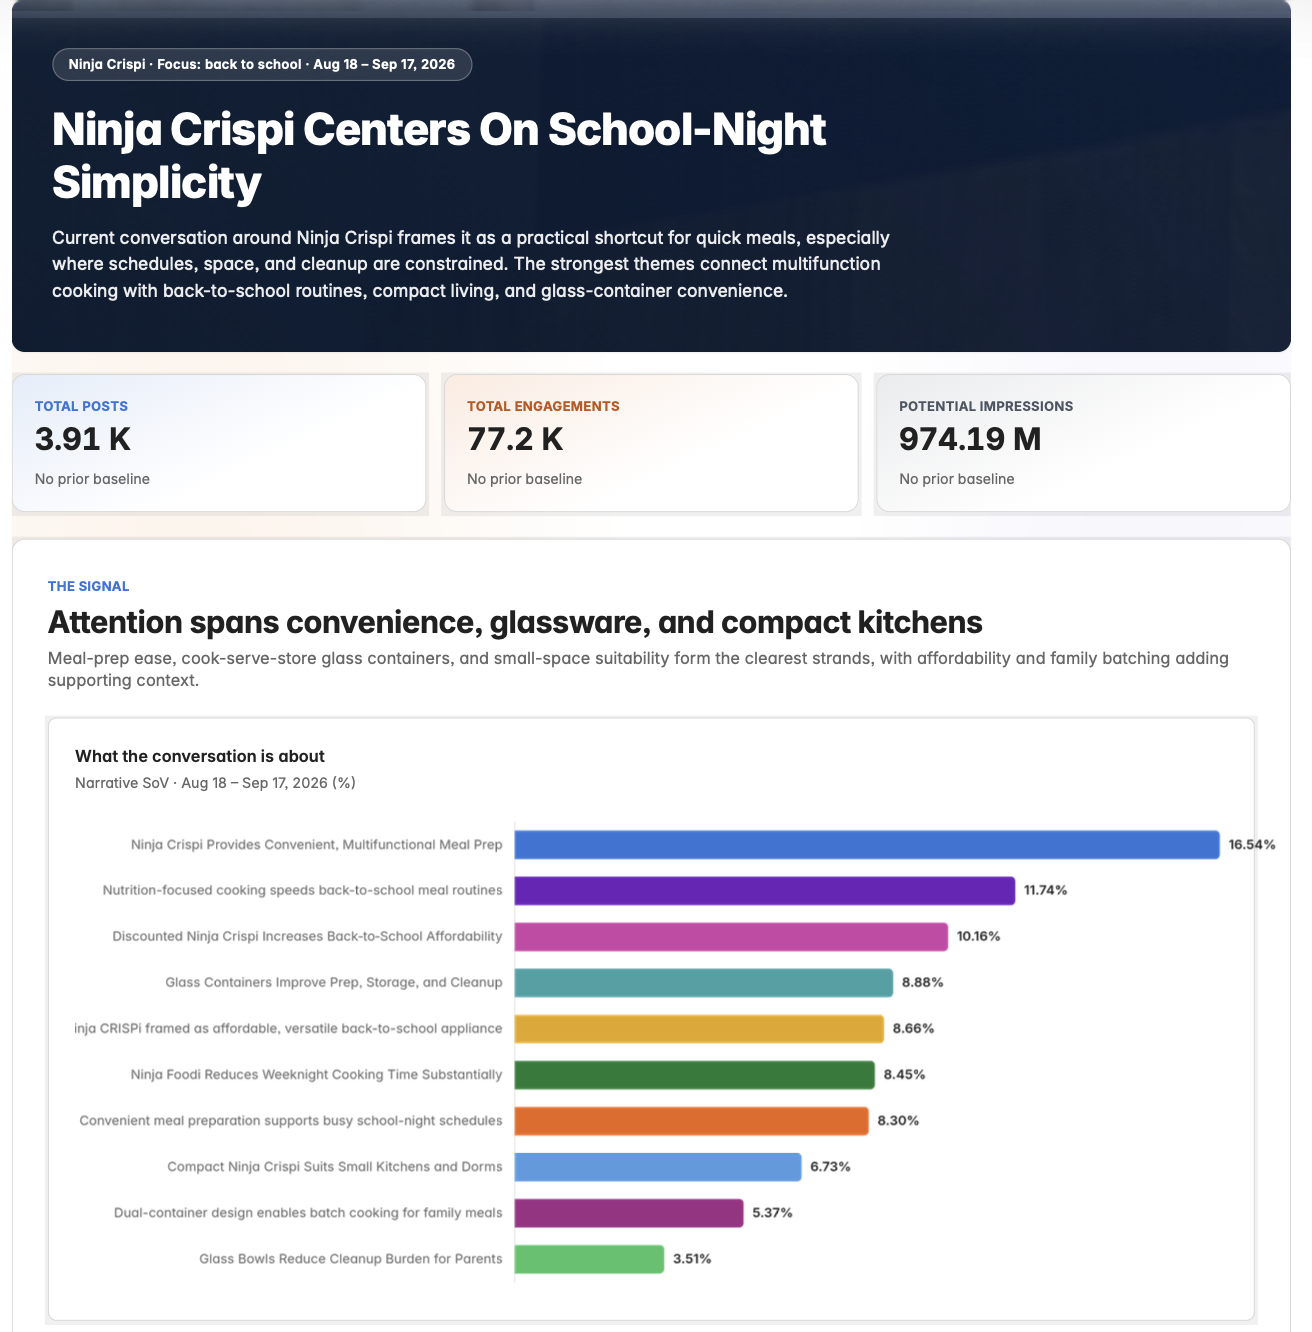
Ninja Crispi had the smallest conversation of the five, with 3.91 thousand posts, 77.2 thousand engagements and 974.19 million potential impressions. Yet its themes connected clearly with time, space and meal-prep constraints.
Convenient multifunctional meal prep represented 16.5% of narrative SoV, followed by nutrition-focused back-to-school meal routines at 11.7% and discounted pricing at 10.2%. The conversation also included small kitchens, compact living and glass containers that move between cooking, serving and storage.
The smaller volume therefore still reveals specific situations in which the product was being discussed. That is useful market intelligence even without the scale seen in the other datasets.
These five conversations do not support a simple winner-and-loser ranking. They show different forms of attention.
For brands, this points to the importance of understanding numbers. Counting mentions tells you how much conversation exists, but examining the themes, sources and consumer reactions tells you what that attention actually means.
Quid helps brands see the structure behind market attention, from the narratives gaining traction to the sources and consumer conversations driving them.
Ready to understand what is driving conversation in your market? Contact Quid to turn market signals into actionable intelligence.
Can social listening show whether a product launch succeeded?
Social and media intelligence can show conversation volume, themes, sources and consumer reactions. Those signals should be evaluated alongside sales and other business measures when assessing commercial performance.
Why can high conversation volume be misleading?
Large datasets can include promotional, media or unrelated conversation. Examining the underlying themes and sources helps establish what the volume actually represents.
What is narrative share of voice?
Narrative share of voice measures how much of a defined conversation is represented by a particular theme. In this analysis, it describes themes within each individual product dataset.
Why compare products across industries?
Cross-industry analysis can show how different consumer needs compete for attention during the same seasonal moment, from school supplies and technology to food, hydration and personal care.
What should brands monitor after back-to-school season?
Brands can continue tracking whether seasonal conversations persist, which use cases remain visible and how consumer questions or objections change as initial promotions fade.